29
/
en
AIzaSyAYiBZKx7MnpbEhh9jyipgxe19OcubqV5w
April 1, 2024
84540
Benin
BEN
true
2
1
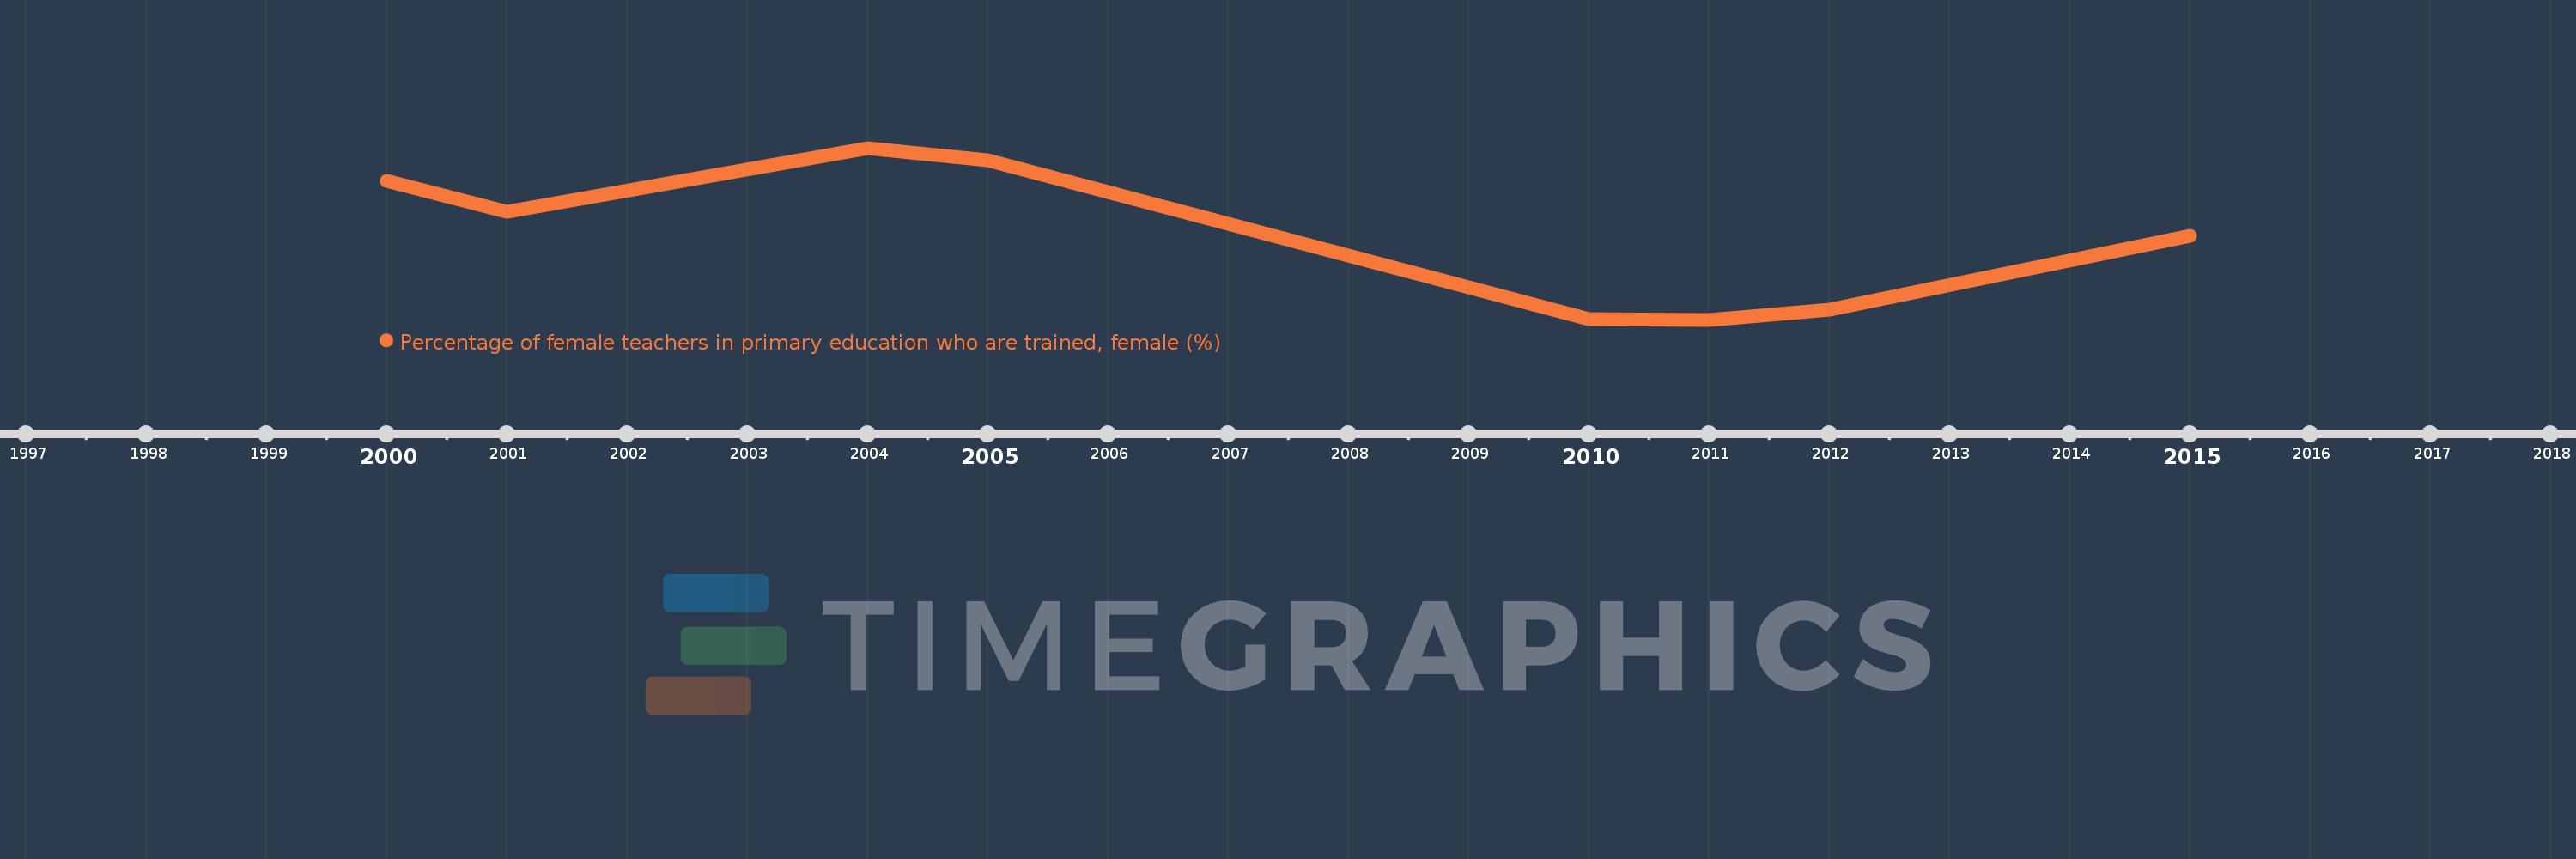
Percentage of female teachers in primary education who are trained, female (%)
2015,2012,2011,2010,2005,2004,2001,2000
This statistics in other country:
Timeline:
This timeline shows a graph from 2000 to 2015 of Benin. No data until 1999. Number of actual observations by date: 8.
Source name:
World Development Indicators
Source organization:
United Nations Educational, Scientific, and Cultural Organization (UNESCO) Institute for Statistics.
Categories, topics:
Education, Gender
Last updated:
apr 23, 2017
Indicators value changes by year
Minimum:
44.736
jan 1, 2011
Maximum:
85.013
jan 1, 2004
At the date of observation
Value
Absolute change
Change from previous value
jan 1, 2000
77.21
+77.21
0.0%
jan 1, 2001
69.987
-7.223
-9.35%
jan 1, 2004
85.013
+15.026
21.47%
jan 1, 2005
82.052
-2.961
-3.48%
jan 1, 2010
44.942
-37.11
-45.23%
jan 1, 2011
44.736
-0.207
-0.46%
jan 1, 2012
47.186
+2.45
5.48%
jan 1, 2015
64.493
+17.307
36.68%
Ranking of countries by current statistics by years


Comments: