29
/
en
AIzaSyAYiBZKx7MnpbEhh9jyipgxe19OcubqV5w
April 1, 2024
172075
Kuwait
KWT
true
2
1
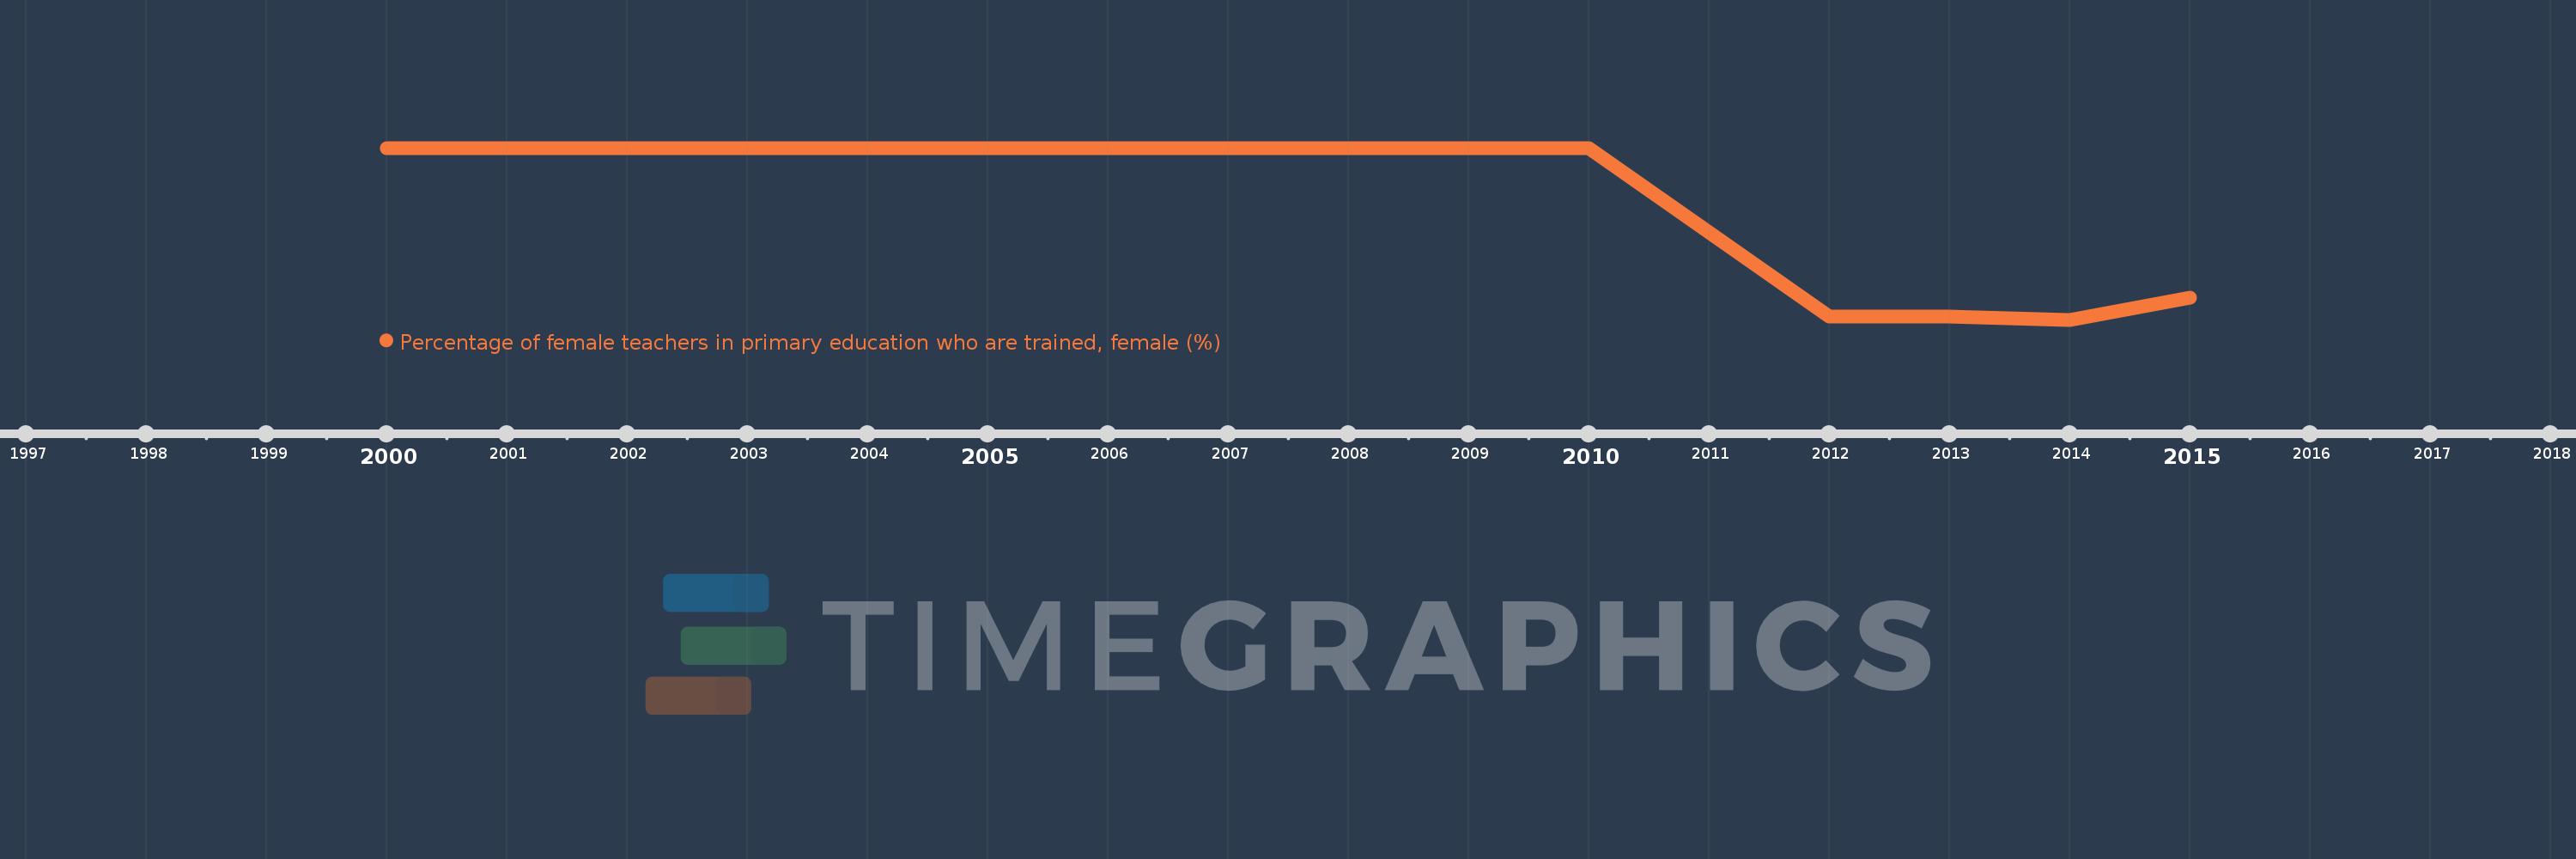
Percentage of female teachers in primary education who are trained, female (%)
2015,2014,2013,2012,2010,2009,2008,2007,2006,2005,2004,2001,2000
This statistics in other country:
Timeline:
This timeline shows a graph from 2000 to 2015 of Kuwait. No data until 1999. Number of actual observations by date: 13.
Source name:
World Development Indicators
Source organization:
United Nations Educational, Scientific, and Cultural Organization (UNESCO) Institute for Statistics.
Categories, topics:
Education, Gender
Last updated:
apr 23, 2017
Indicators value changes by year
Minimum:
79.626
jan 1, 2014
At the date of observation
Value
Absolute change
Change from previous value
jan 1, 2000
100.0
+100.0
0.0%
jan 1, 2001
100.0
0.0
0.0%
jan 1, 2004
100.0
0.0
0.0%
jan 1, 2005
100.0
0.0
0.0%
jan 1, 2006
100.0
0.0
0.0%
jan 1, 2007
100.0
0.0
0.0%
jan 1, 2008
100.0
0.0
0.0%
jan 1, 2009
100.0
0.0
0.0%
jan 1, 2010
100.0
0.0
0.0%
jan 1, 2012
79.981
-20.019
-20.02%
jan 1, 2013
80.041
+0.06
0.07%
jan 1, 2014
79.626
-0.415
-0.52%
jan 1, 2015
82.2
+2.573
3.23%
Ranking of countries by current statistics by years


Comments: