29
/
en
AIzaSyAYiBZKx7MnpbEhh9jyipgxe19OcubqV5w
April 1, 2024
140855
Ghana
GHA
true
2
1
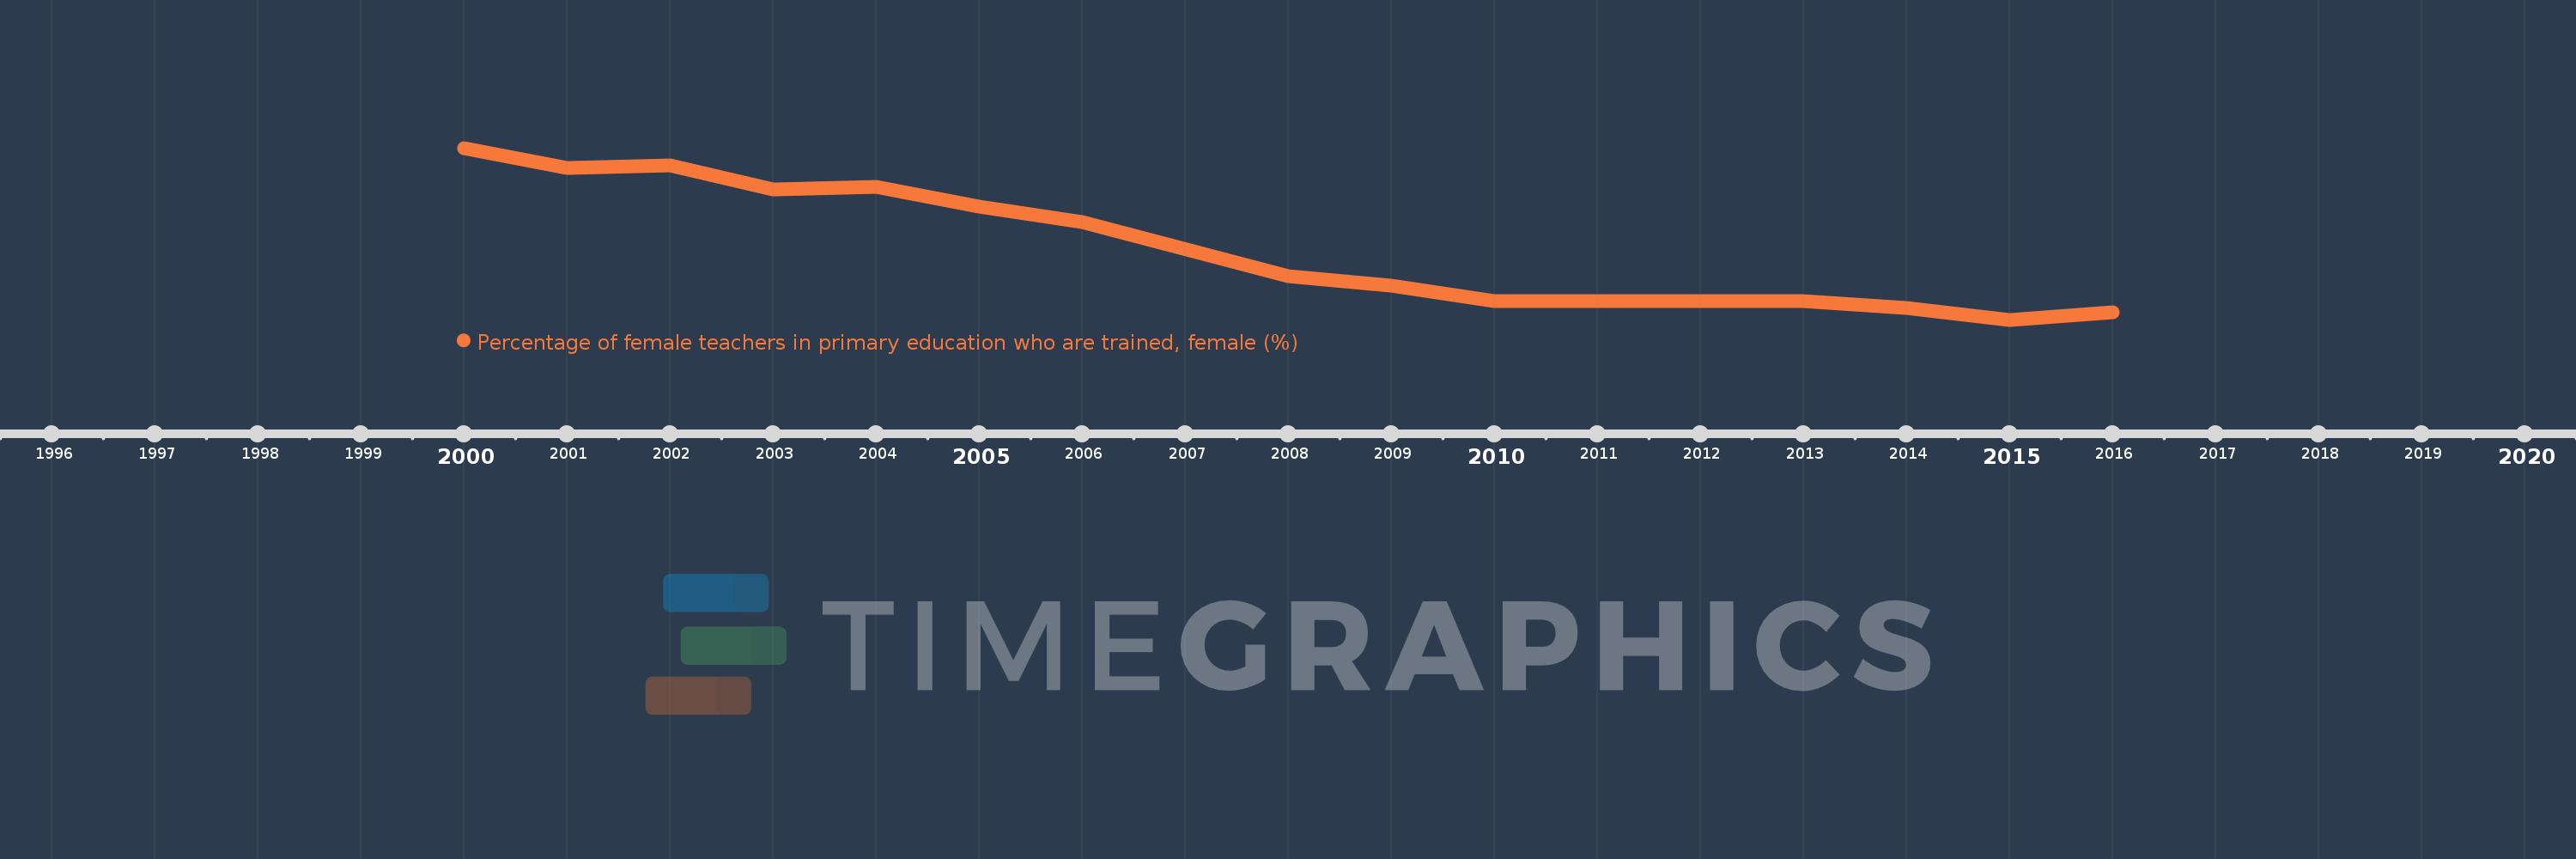
Percentage of female teachers in primary education who are trained, female (%)
2016,2015,2014,2013,2012,2010,2009,2008,2006,2005,2004,2003,2002,2001,2000
This statistics in other country:
Timeline:
This timeline shows a graph from 2000 to 2016 of Ghana. No data until 1999. Number of actual observations by date: 15.
Source name:
World Development Indicators
Source organization:
United Nations Educational, Scientific, and Cultural Organization (UNESCO) Institute for Statistics.
Categories, topics:
Education, Gender
Last updated:
apr 23, 2017
Indicators value changes by year
Minimum:
63.506
jan 1, 2015
Maximum:
88.535
jan 1, 2000
At the date of observation
Value
Absolute change
Change from previous value
jan 1, 2000
88.535
+88.535
0.0%
jan 1, 2001
85.619
-2.917
-3.29%
jan 1, 2002
85.936
+0.317
0.37%
jan 1, 2003
82.471
-3.465
-4.03%
jan 1, 2004
82.828
+0.357
0.43%
jan 1, 2005
80.019
-2.809
-3.39%
jan 1, 2006
77.773
-2.245
-2.81%
jan 1, 2008
69.869
-7.904
-10.16%
jan 1, 2009
68.436
-1.434
-2.05%
jan 1, 2010
66.233
-2.202
-3.22%
jan 1, 2012
66.187
-0.046
-0.07%
jan 1, 2013
66.166
-0.021
-0.03%
jan 1, 2014
65.16
-1.006
-1.52%
jan 1, 2015
63.506
-1.654
-2.54%
jan 1, 2016
64.657
+1.151
1.81%
Ranking of countries by current statistics by years


Comments: