29
/
en
AIzaSyAYiBZKx7MnpbEhh9jyipgxe19OcubqV5w
April 1, 2024
69145
Antigua and Barbuda
ATG
true
2
1
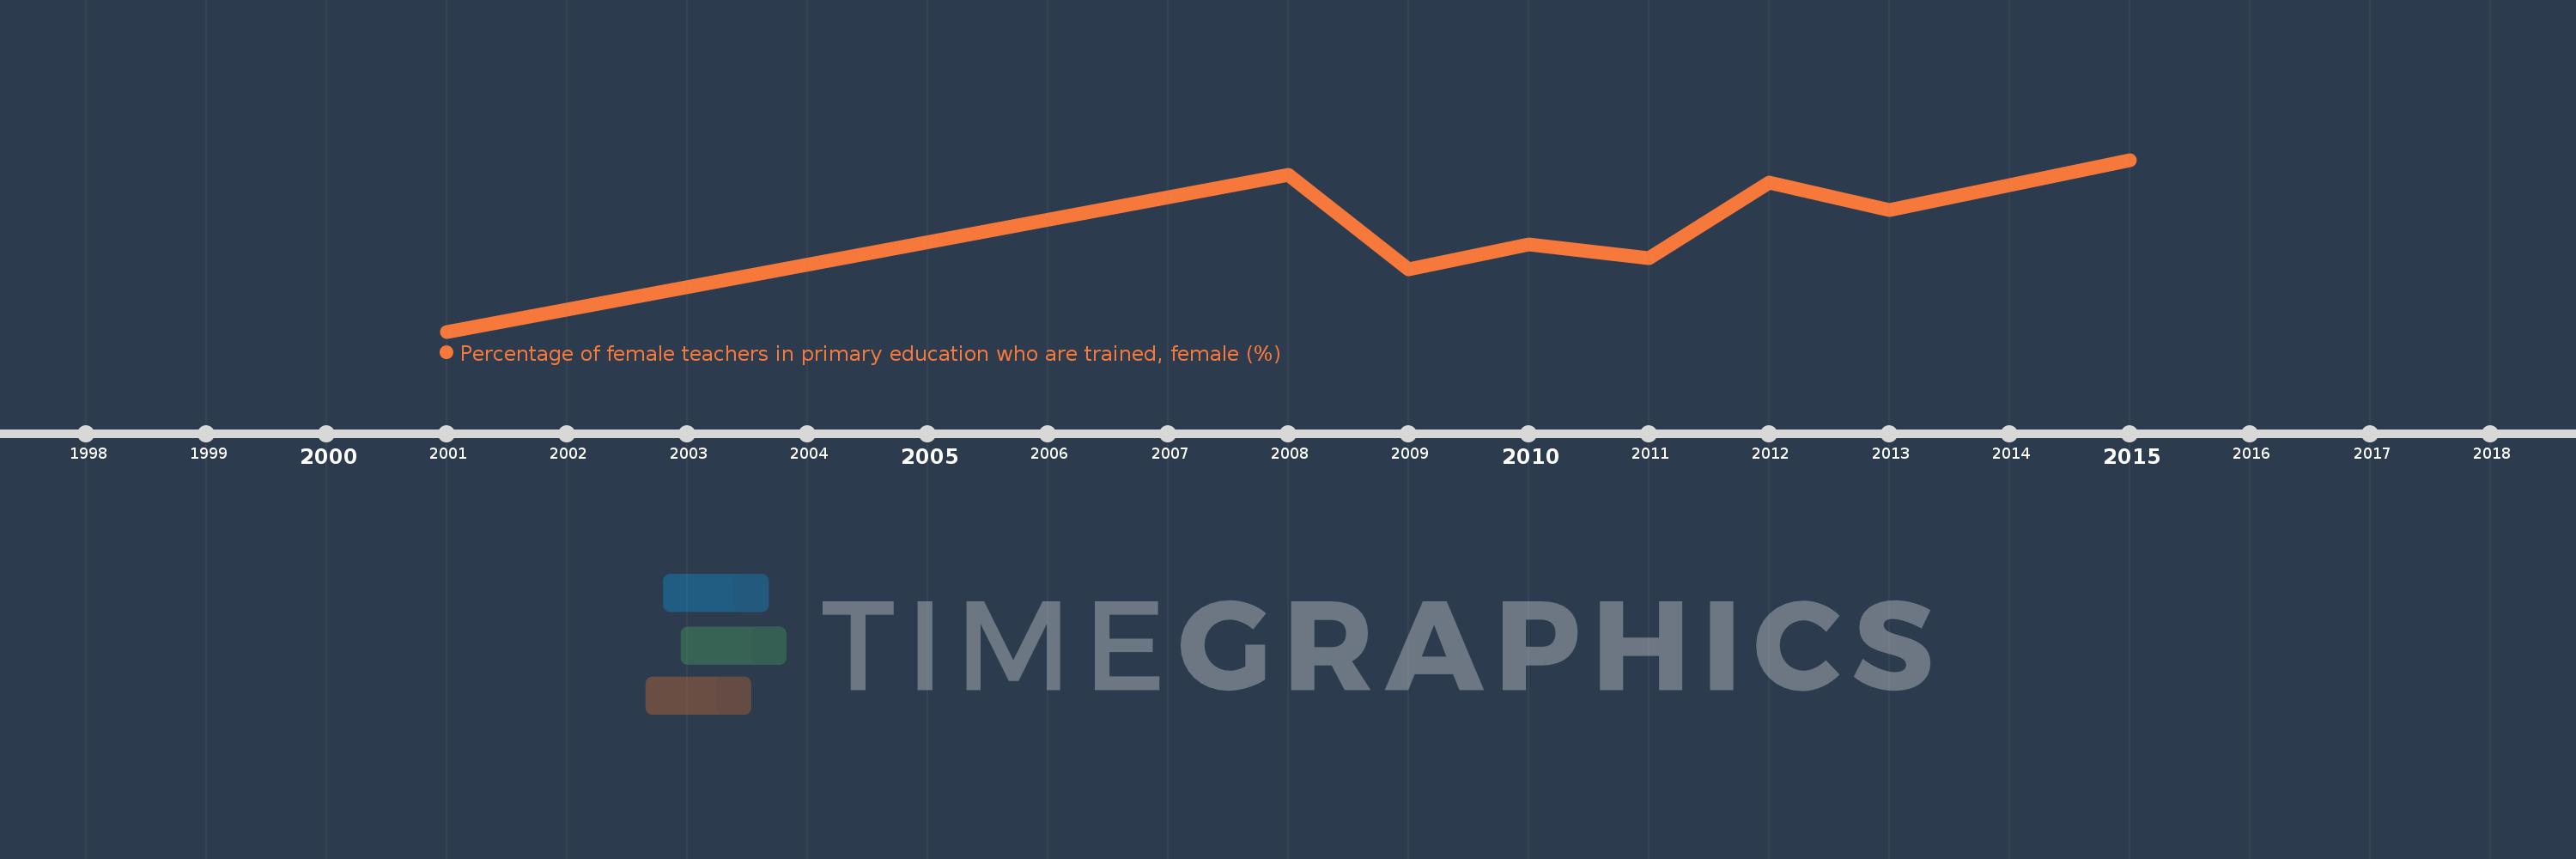
Percentage of female teachers in primary education who are trained, female (%)
2015,2013,2012,2011,2010,2009,2008,2001
This statistics in other country:
Timeline:
This timeline shows a graph from 2001 to 2015 of Antigua and Barbuda. No data until 2000. Number of actual observations by date: 8.
Source name:
World Development Indicators
Source organization:
United Nations Educational, Scientific, and Cultural Organization (UNESCO) Institute for Statistics.
Categories, topics:
Education, Gender
Last updated:
apr 23, 2017
Indicators value changes by year
Minimum:
43.693
jan 1, 2001
Maximum:
69.289
jan 1, 2015
At the date of observation
Value
Absolute change
Change from previous value
jan 1, 2001
43.693
+43.693
0.0%
jan 1, 2008
67.002
+23.309
53.35%
jan 1, 2009
52.932
-14.07
-21.0%
jan 1, 2010
56.667
+3.735
7.06%
jan 1, 2011
54.61
-2.057
-3.63%
jan 1, 2012
65.836
+11.226
20.56%
jan 1, 2013
61.782
-4.054
-6.16%
jan 1, 2015
69.289
+7.507
12.15%
Ranking of countries by current statistics by years


Comments: