30
/
AIzaSyAYiBZKx7MnpbEhh9jyipgxe19OcubqV5w
April 1, 2024
168919
Kiribati
KIR
true
2
1
Percentage of female teachers in primary education who are trained, female (%)
2009,2008,2007,2006
Download
Global statistics library →Kiribati →

Percentage of female teachers in primary education who are trained, female (%)

This statistics in other country:

AlgeriaAndorraAngolaAntigua and BarbudaArab WorldArmeniaArubaAzerbaijanBahamas, TheBahrainBangladeshBarbadosBelarusBelizeBeninBermudaBhutanBoliviaBotswanaBritish Virgin IslandsBrunei DarussalamBurkina FasoBurundiCabo VerdeCambodiaCameroonCaribbean small statesCayman IslandsCentral African RepublicColombiaComorosCongo, Dem. Rep.Congo, Rep.Costa RicaCote d'IvoireCroatiaCubaDjiboutiDominicaDominican RepublicEcuadorEgypt, Arab Rep.El SalvadorEquatorial GuineaEritreaEthiopiaFijiFragile and conflict affected situationsGabonGambia, TheGeorgiaGhanaGibraltarGrenadaGuineaGuinea-BissauGuyanaHeavily indebted poor countries (HIPC)HondurasHong Kong SAR, ChinaIDA blendIDA onlyIDA totalIran, Islamic Rep.IraqJamaicaKazakhstanKenyaKiribatiKuwaitKyrgyz RepublicLao PDRLeast developed countries: UN classificationLebanonLesothoLiberiaLow incomeMacao SAR, ChinaMadagascarMalawiMalaysiaMaldivesMaliMauritaniaMauritiusMiddle East & North AfricaMiddle East & North Africa (excluding high income)Middle East & North Africa (IDA & IBRD countries)MoldovaMongoliaMoroccoMozambiqueMyanmarNamibiaNauruNepalNicaraguaNigerNigeriaOmanOther small statesPacific island small statesPakistanPanamaParaguayPhilippinesPre-demographic dividendQatarRwandaSao Tome and PrincipeSaudi ArabiaSenegalSerbiaSeychellesSierra LeoneSingaporeSmall statesSolomon IslandsSouth AfricaSt. Kitts and NevisSt. LuciaSt. Vincent and the GrenadinesSub-Saharan Africa Sub-Saharan Africa (excluding high income)Sub-Saharan Africa (IDA & IBRD countries)SurinameSwazilandSyrian Arab RepublicTajikistanTanzaniaTogoTongaTrinidad and TobagoTunisiaTurks and Caicos IslandsUgandaUnited Arab EmiratesUzbekistanVietnamWest Bank and GazaZambiaZimbabwe

Timeline:

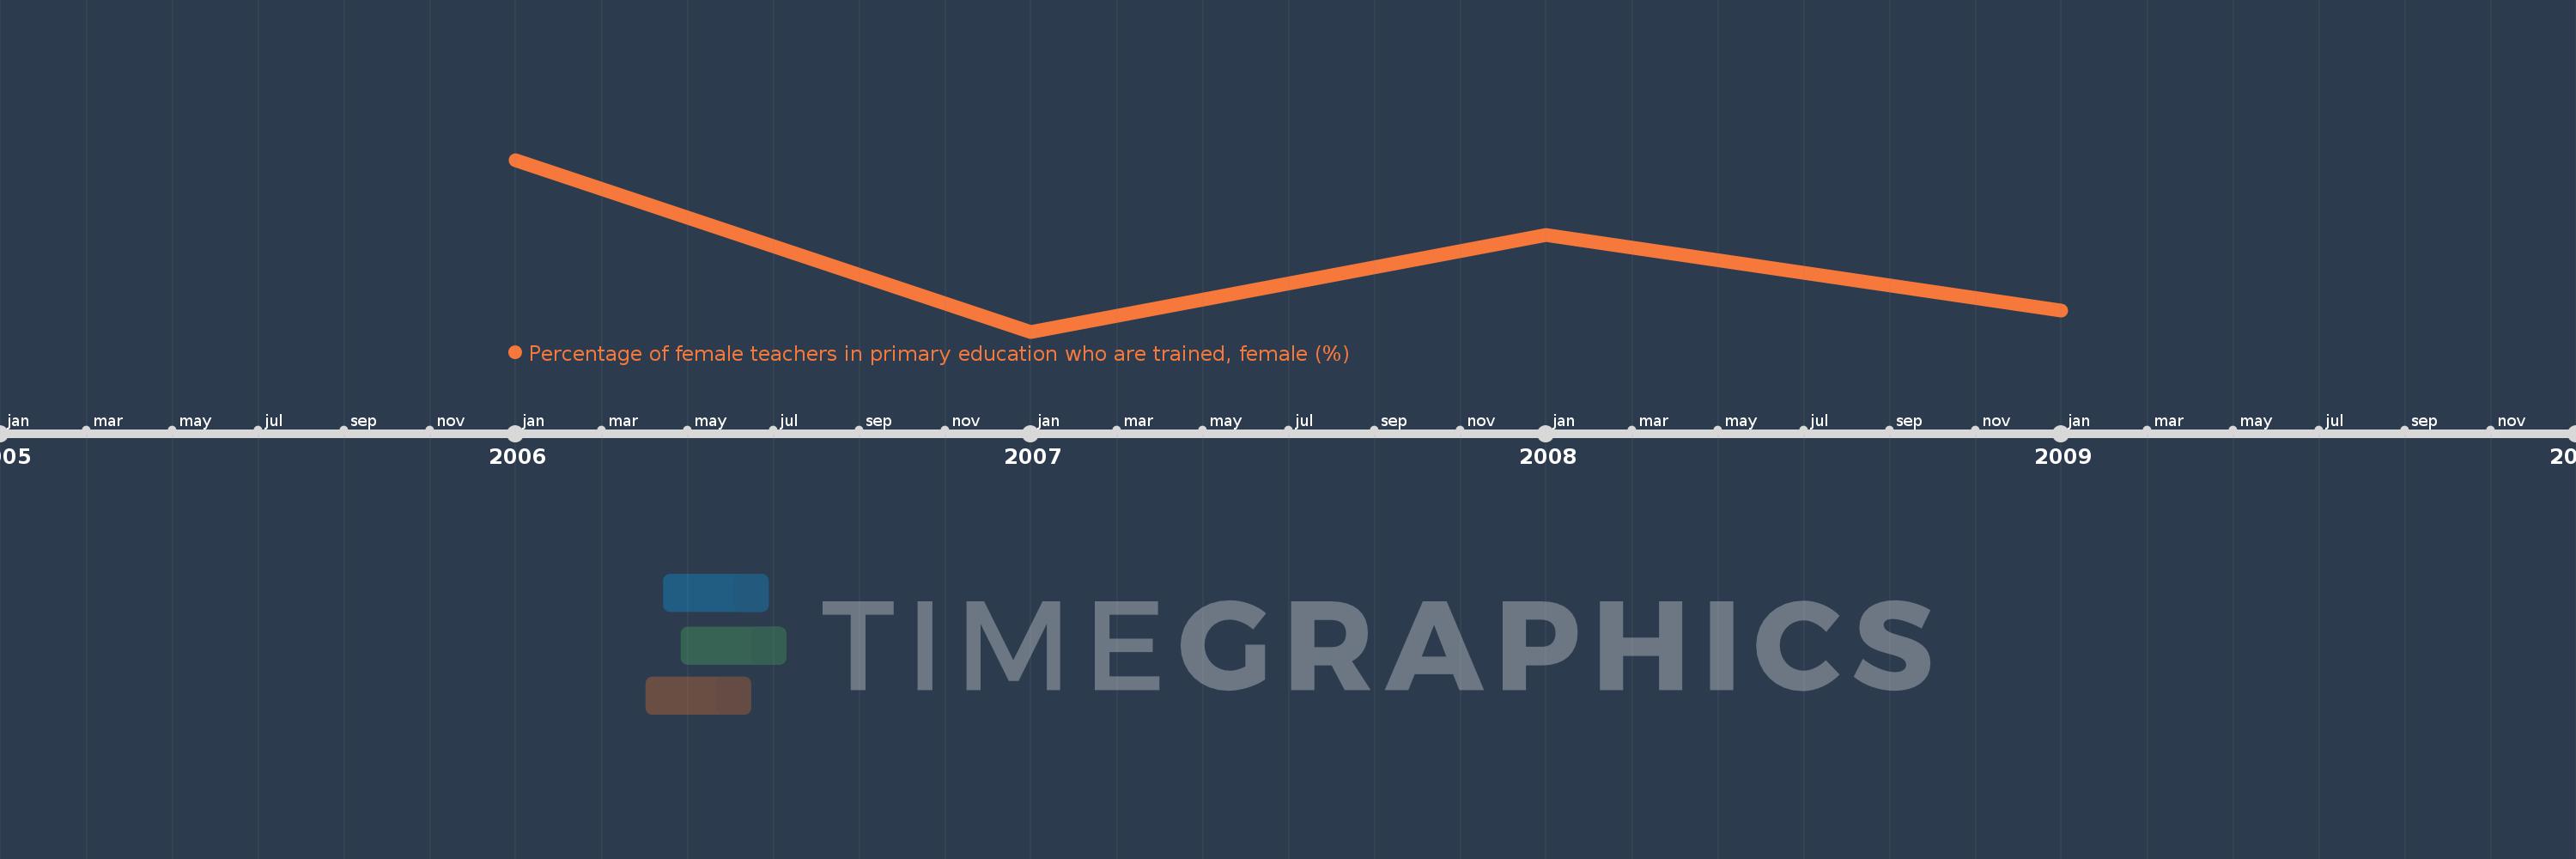
This timeline shows a graph from 2006 to 2009 of Kiribati. No data until 2005. Number of actual observations by date: 4.

Source name:

World Development Indicators

Source organization:

United Nations Educational, Scientific, and Cultural Organization (UNESCO) Institute for Statistics.

Categories, topics:

Education, Gender

Last updated:

apr 23, 2017

Indicators value changes by year

Meaning:
89.036
Minimum:
84.664
jan 1, 2007
Maximum:
95.052
jan 1, 2006
At the date of observation
Value
Absolute change
Change from the previous value
jan 1, 2006
95.052
+95.052
0.0%
jan 1, 2007
84.664
-10.388
-10.93%
jan 1, 2008
90.495
+5.831
6.89%
jan 1, 2009
85.932
-4.563
-5.04%

Ranking of countries by current statistics by years