29
/
en
AIzaSyAYiBZKx7MnpbEhh9jyipgxe19OcubqV5w
April 1, 2024
34506
Fragile and conflict affected situations
FCS
false
2
1
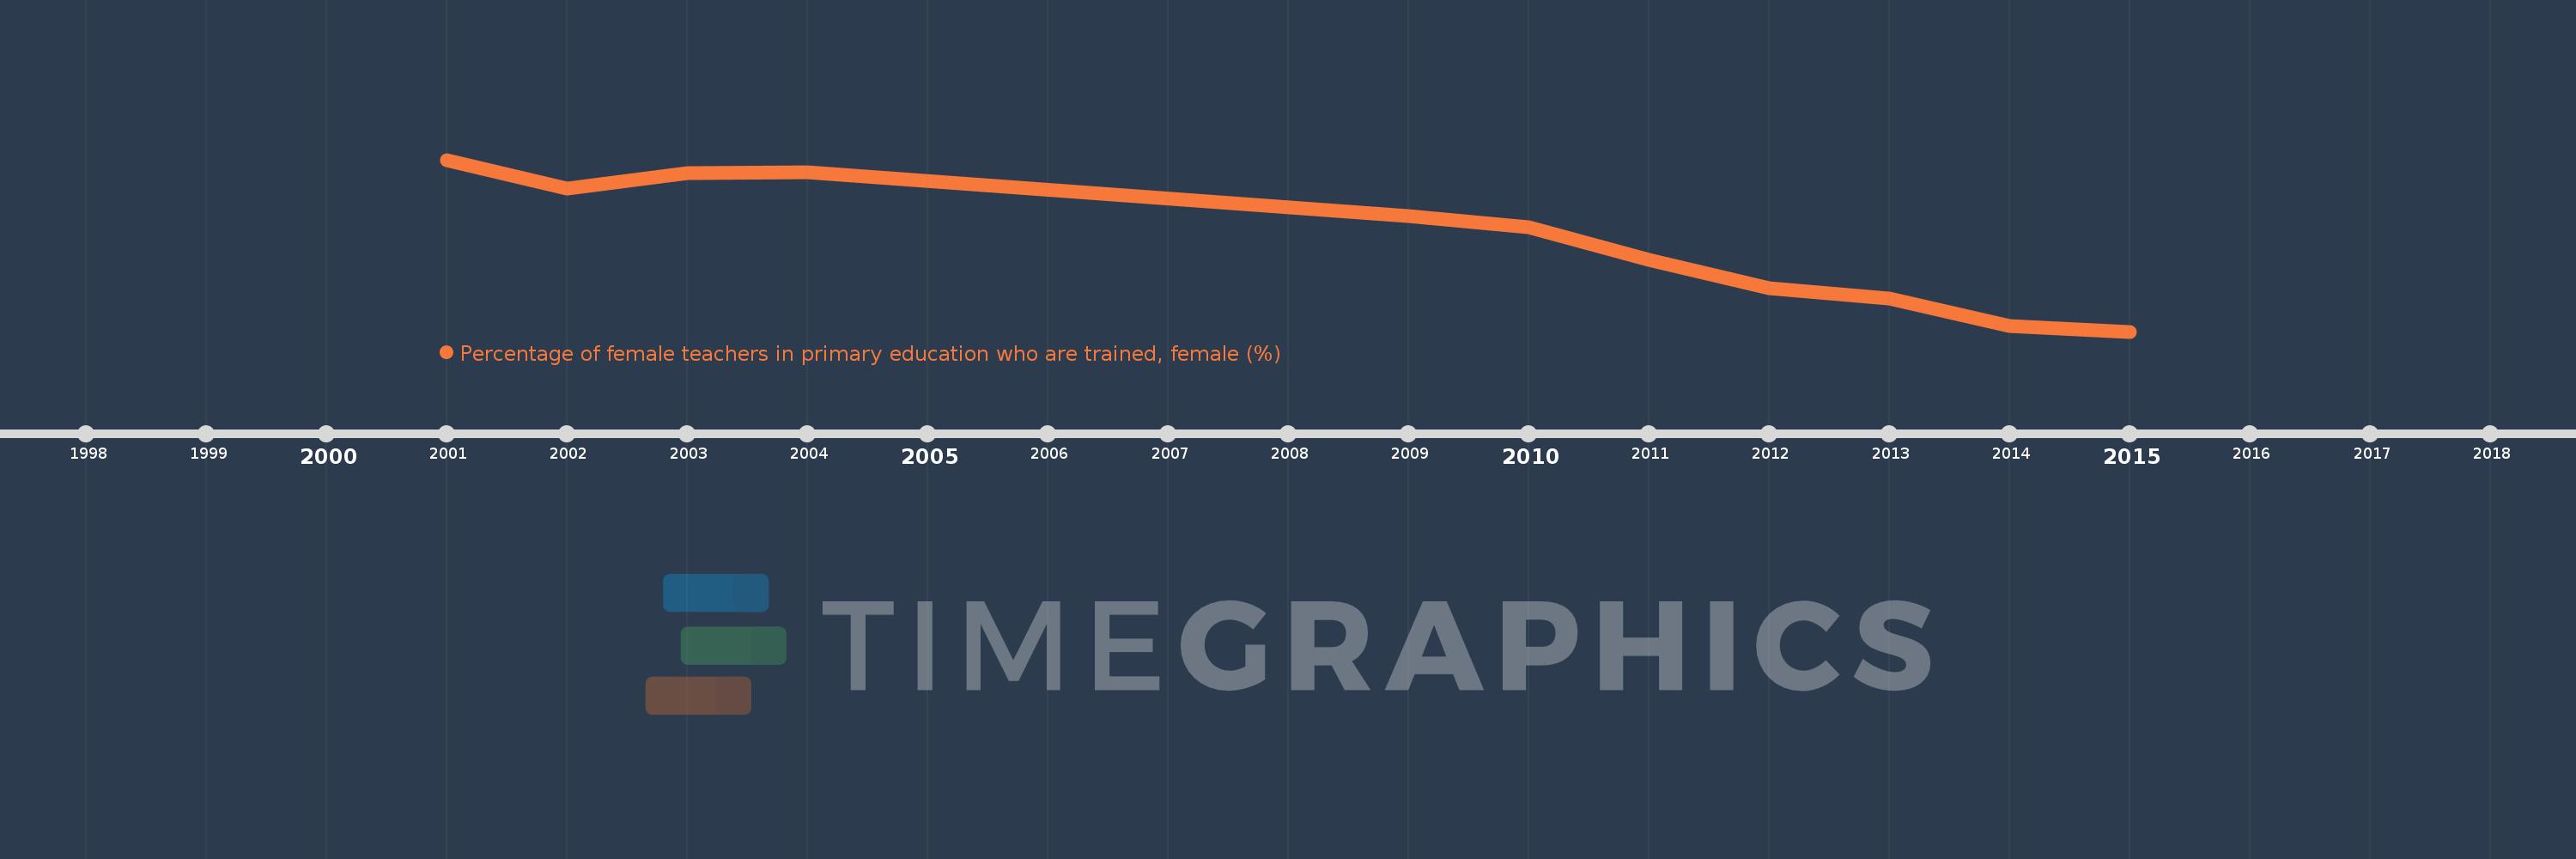
Percentage of female teachers in primary education who are trained, female (%)
2015,2014,2013,2012,2011,2010,2009,2004,2003,2002,2001
This statistics in other country:
Timeline:
This timeline shows a graph from 2001 to 2015 of Fragile and conflict affected situations. No data until 2000. Number of actual observations by date: 11.
Source name:
World Development Indicators
Source organization:
United Nations Educational, Scientific, and Cultural Organization (UNESCO) Institute for Statistics.
Categories, topics:
Education, Gender
Last updated:
apr 23, 2017
Indicators value changes by year
Minimum:
79.799
jan 1, 2015
Maximum:
87.753
jan 1, 2001
At the date of observation
Value
Absolute change
Change from previous value
jan 1, 2001
87.753
+87.753
0.0%
jan 1, 2002
86.44
-1.313
-1.5%
jan 1, 2003
87.127
+0.686
0.79%
jan 1, 2004
87.196
+0.07
0.08%
jan 1, 2009
85.135
-2.061
-2.36%
jan 1, 2010
84.624
-0.511
-0.6%
jan 1, 2011
83.105
-1.52
-1.8%
jan 1, 2012
81.802
-1.303
-1.57%
jan 1, 2013
81.348
-0.453
-0.55%
jan 1, 2014
80.052
-1.296
-1.59%
jan 1, 2015
79.799
-0.253
-0.32%
Ranking of countries by current statistics by years


Comments: