29
/
en
AIzaSyAYiBZKx7MnpbEhh9jyipgxe19OcubqV5w
April 1, 2024
151917
Hong Kong SAR, China
HKG
true
2
1
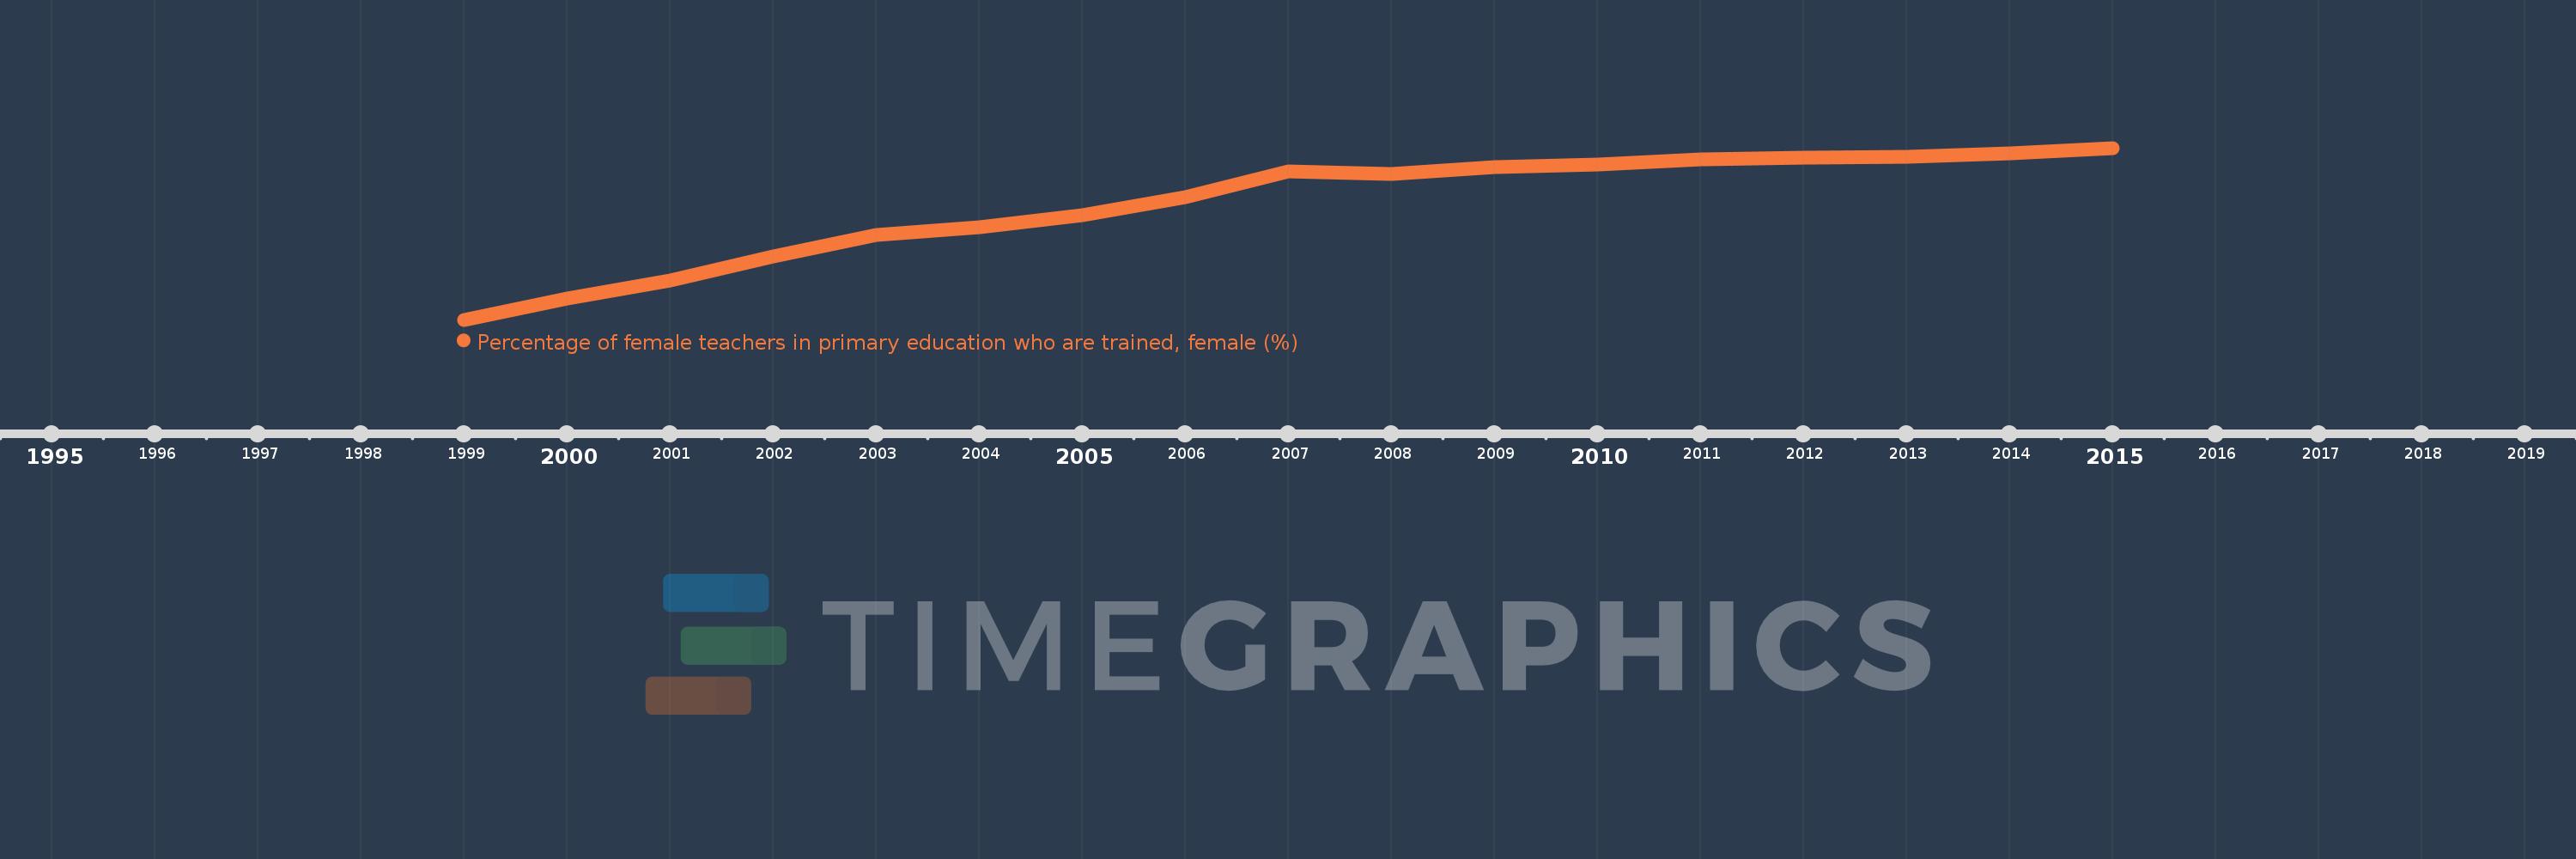
Percentage of female teachers in primary education who are trained, female (%)
2015,2014,2013,2012,2011,2010,2009,2008,2007,2006,2005,2004,2003,2002,2001,2000,1999
This statistics in other country:
Timeline:
This timeline shows a graph from 1999 to 2015 of Hong Kong SAR, China. No data until 1998. Number of actual observations by date: 17.
Source name:
World Development Indicators
Source organization:
United Nations Educational, Scientific, and Cultural Organization (UNESCO) Institute for Statistics.
Categories, topics:
Education, Gender
Last updated:
apr 23, 2017
Indicators value changes by year
Maximum:
96.752
jan 1, 2015
At the date of observation
Value
Absolute change
Change from previous value
jan 1, 1999
84.6
+84.6
0.0%
jan 1, 2000
86.086
+1.486
1.76%
jan 1, 2001
87.369
+1.282
1.49%
jan 1, 2002
89.102
+1.734
1.98%
jan 1, 2003
90.612
+1.509
1.69%
jan 1, 2004
91.147
+0.535
0.59%
jan 1, 2005
92.01
+0.863
0.95%
jan 1, 2006
93.297
+1.288
1.4%
jan 1, 2007
95.104
+1.806
1.94%
jan 1, 2008
94.896
-0.207
-0.22%
jan 1, 2009
95.423
+0.527
0.56%
jan 1, 2010
95.56
+0.137
0.14%
jan 1, 2011
95.948
+0.387
0.41%
jan 1, 2012
96.063
+0.115
0.12%
jan 1, 2013
96.097
+0.034
0.04%
jan 1, 2014
96.369
+0.272
0.28%
jan 1, 2015
96.752
+0.383
0.4%
Ranking of countries by current statistics by years


Comments: