29
/
en
AIzaSyAYiBZKx7MnpbEhh9jyipgxe19OcubqV5w
April 1, 2024
44552
Least developed countries: UN classification
LDC
false
2
1
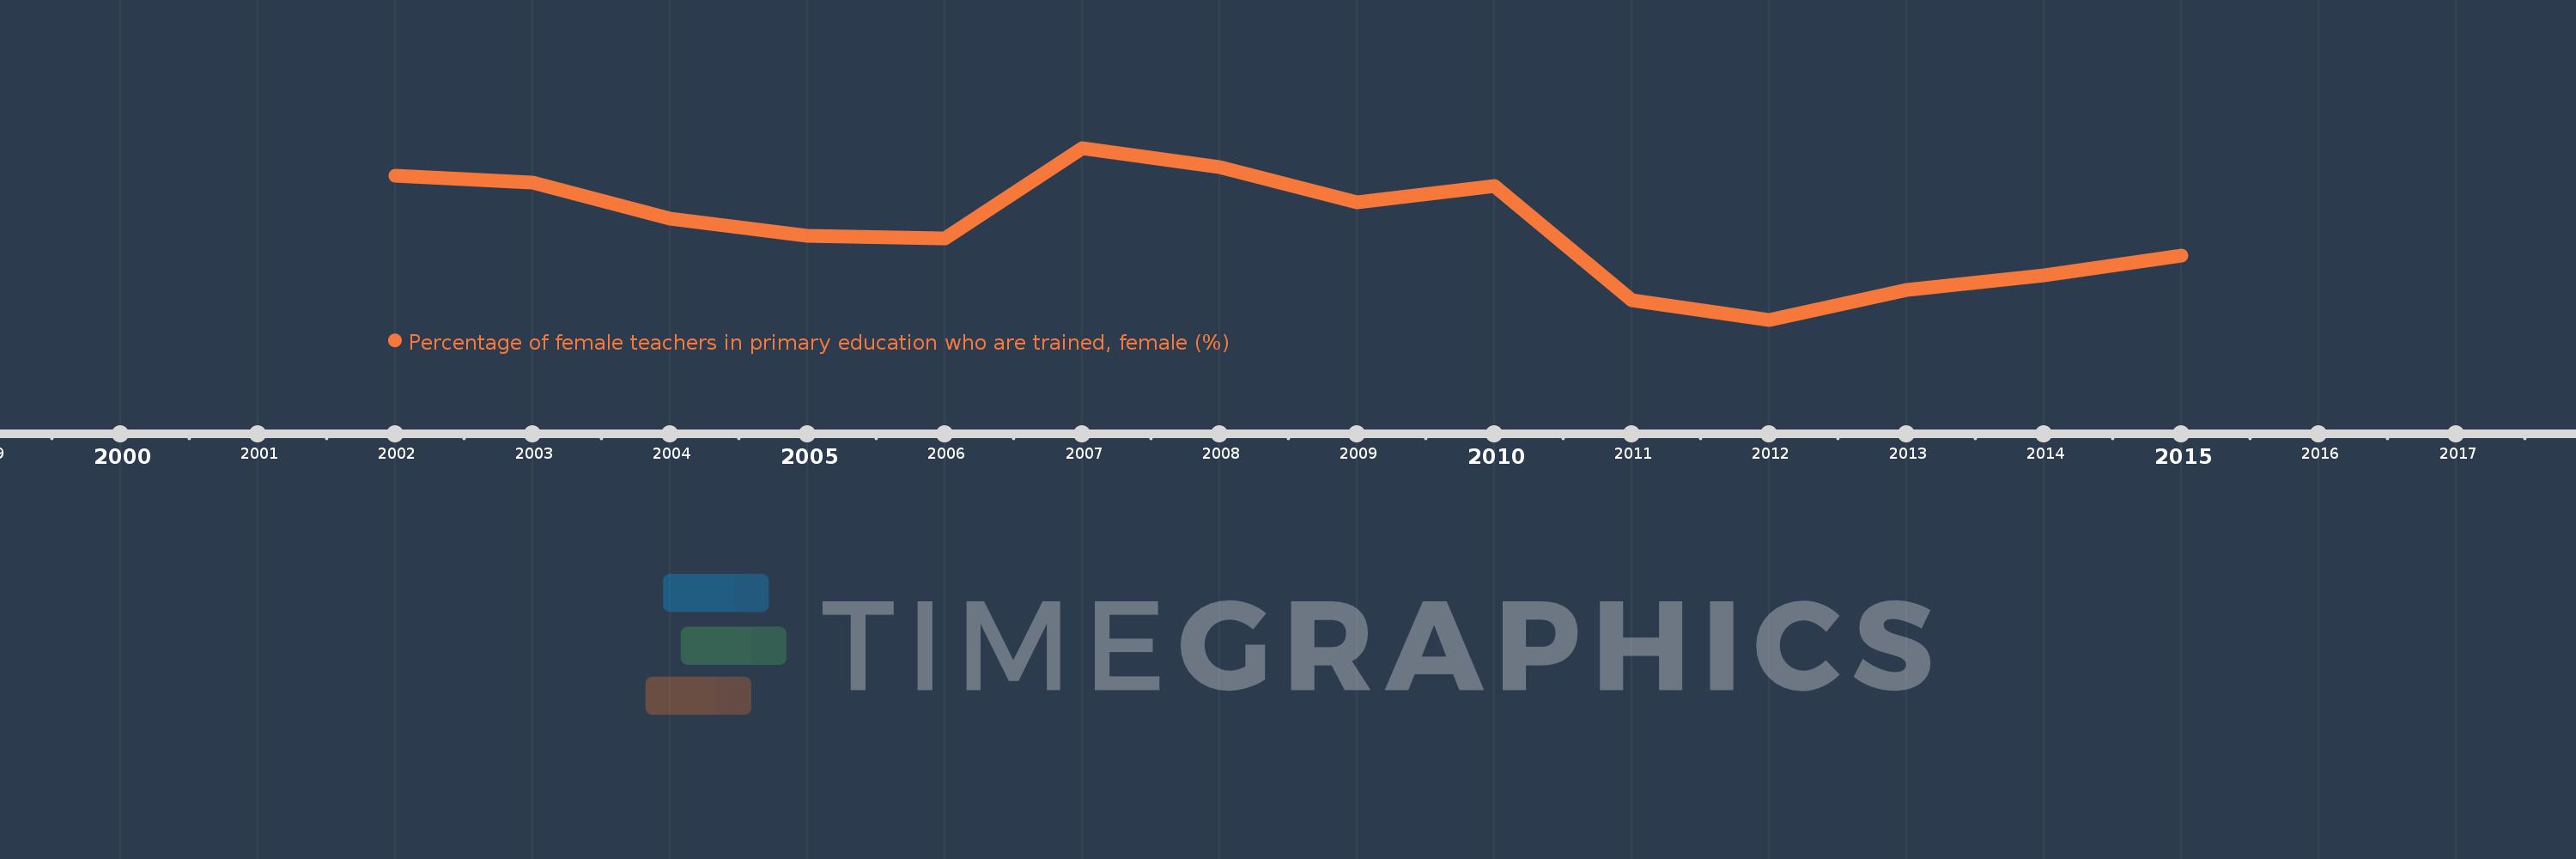
Percentage of female teachers in primary education who are trained, female (%)
2015,2014,2013,2012,2011,2010,2009,2008,2007,2006,2005,2004,2003,2002
This statistics in other country:
Timeline:
This timeline shows a graph from 2002 to 2015 of Least developed countries: UN classification. No data until 2001. Number of actual observations by date: 14.
Source name:
World Development Indicators
Source organization:
United Nations Educational, Scientific, and Cultural Organization (UNESCO) Institute for Statistics.
Categories, topics:
Education, Gender
Last updated:
apr 23, 2017
Indicators value changes by year
Minimum:
76.077
jan 1, 2012
Maximum:
83.536
jan 1, 2007
At the date of observation
Value
Absolute change
Change from previous value
jan 1, 2002
82.326
+82.326
0.0%
jan 1, 2003
82.027
-0.299
-0.36%
jan 1, 2004
80.455
-1.572
-1.92%
jan 1, 2005
79.705
-0.75
-0.93%
jan 1, 2006
79.62
-0.084
-0.11%
jan 1, 2007
83.536
+3.916
4.92%
jan 1, 2008
82.716
-0.82
-0.98%
jan 1, 2009
81.157
-1.559
-1.88%
jan 1, 2010
81.872
+0.715
0.88%
jan 1, 2011
76.931
-4.941
-6.03%
jan 1, 2012
76.077
-0.854
-1.11%
jan 1, 2013
77.368
+1.291
1.7%
jan 1, 2014
77.989
+0.621
0.8%
jan 1, 2015
78.854
+0.865
1.11%
Ranking of countries by current statistics by years


Comments: