29
/
en
AIzaSyAYiBZKx7MnpbEhh9jyipgxe19OcubqV5w
April 1, 2024
173313
Kyrgyz Republic
KGZ
true
2
1
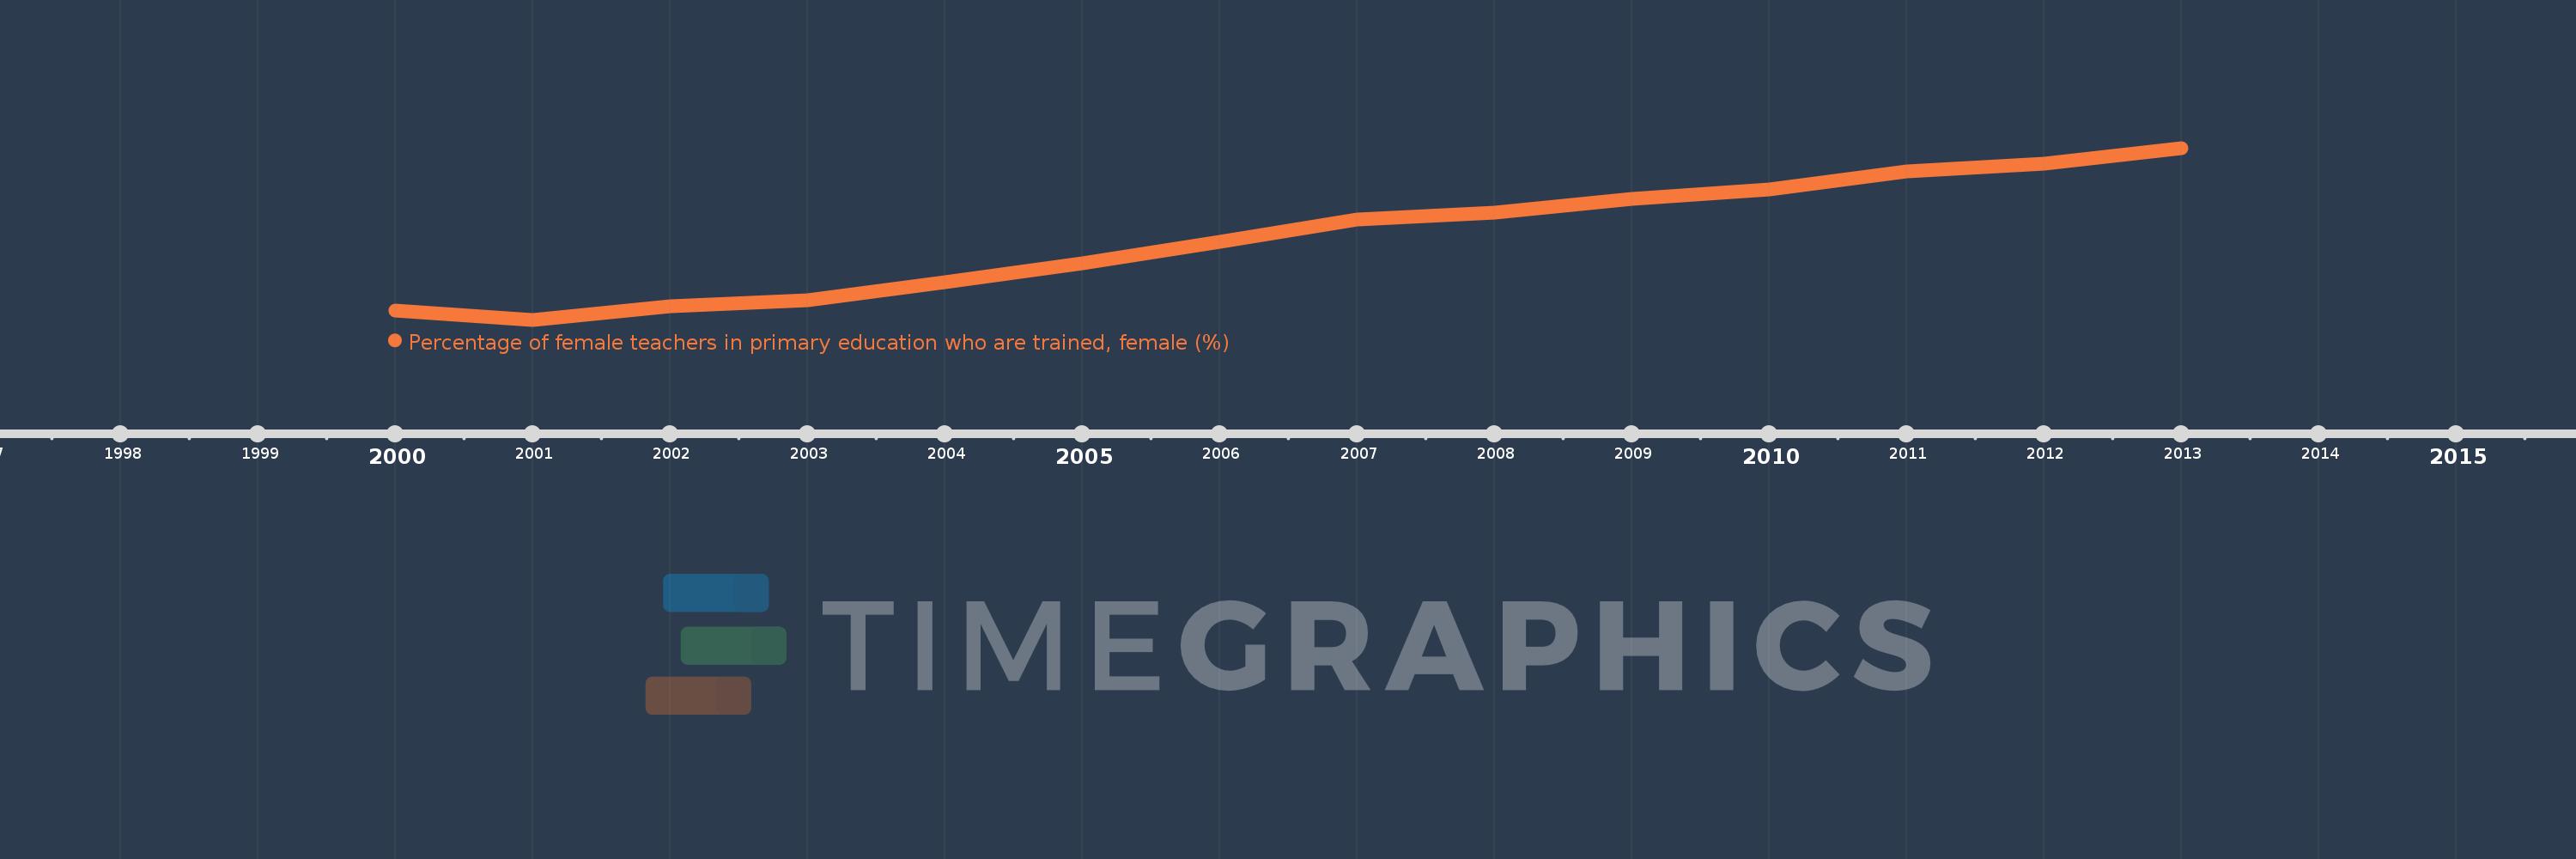
Percentage of female teachers in primary education who are trained, female (%)
2013,2012,2011,2010,2009,2008,2007,2006,2005,2004,2003,2002,2001,2000
This statistics in other country:
Timeline:
This timeline shows a graph from 2000 to 2013 of Kyrgyz Republic. No data until 1999. Number of actual observations by date: 14.
Source name:
World Development Indicators
Source organization:
United Nations Educational, Scientific, and Cultural Organization (UNESCO) Institute for Statistics.
Categories, topics:
Education, Gender
Last updated:
apr 23, 2017
Indicators value changes by year
Minimum:
46.363
jan 1, 2001
Maximum:
71.958
jan 1, 2013
At the date of observation
Value
Absolute change
Change from previous value
jan 1, 2000
47.678
+47.678
0.0%
jan 1, 2001
46.363
-1.315
-2.76%
jan 1, 2002
48.41
+2.048
4.42%
jan 1, 2003
49.261
+0.851
1.76%
jan 1, 2004
52.005
+2.744
5.57%
jan 1, 2005
54.818
+2.812
5.41%
jan 1, 2006
57.958
+3.141
5.73%
jan 1, 2007
61.259
+3.3
5.69%
jan 1, 2008
62.36
+1.101
1.8%
jan 1, 2009
64.377
+2.017
3.23%
jan 1, 2010
65.741
+1.364
2.12%
jan 1, 2011
68.412
+2.671
4.06%
jan 1, 2012
69.645
+1.233
1.8%
jan 1, 2013
71.958
+2.313
3.32%
Ranking of countries by current statistics by years


Comments: