29
/
en
AIzaSyAYiBZKx7MnpbEhh9jyipgxe19OcubqV5w
April 1, 2024
35271
Heavily indebted poor countries (HIPC)
HPC
false
2
1
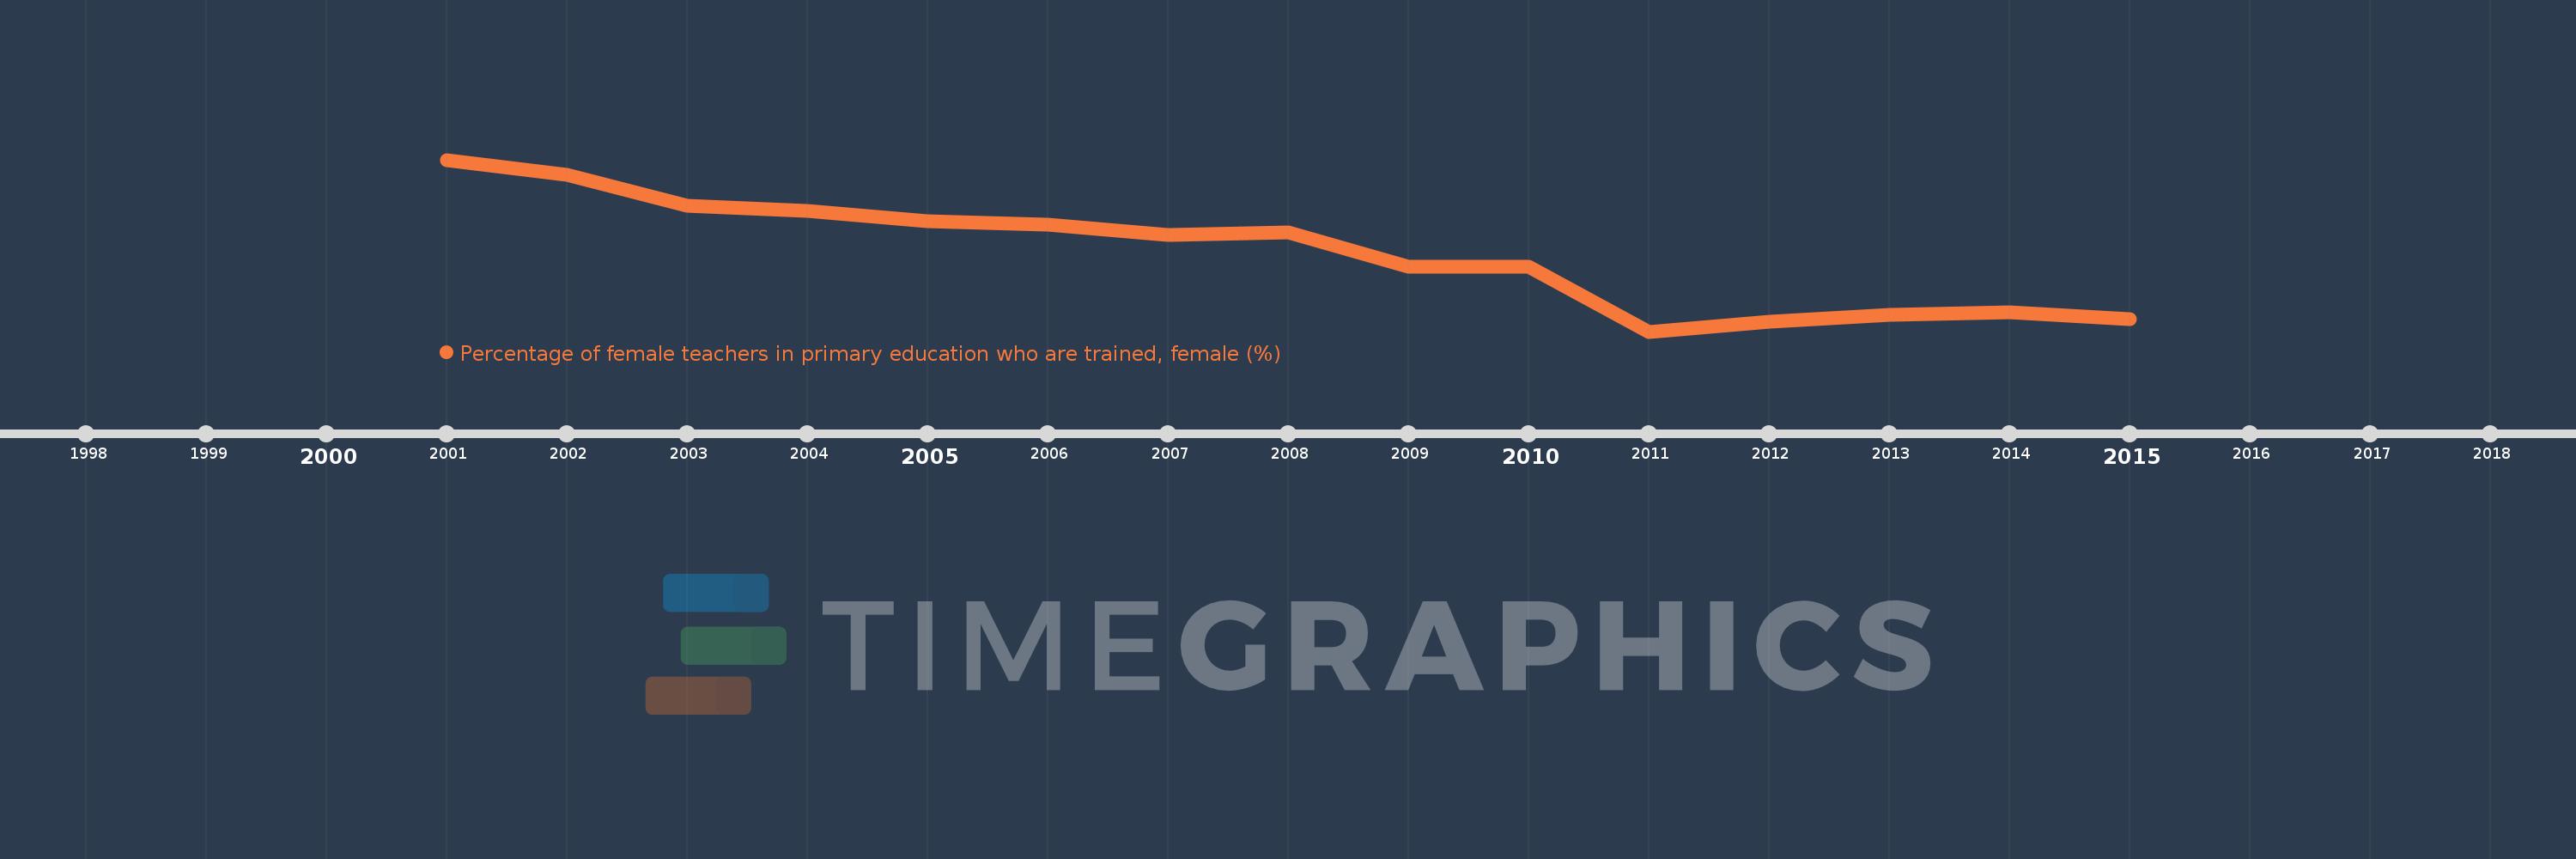
Percentage of female teachers in primary education who are trained, female (%)
2015,2014,2013,2012,2011,2010,2009,2008,2007,2006,2005,2004,2003,2002,2001
This statistics in other country:
Timeline:
This timeline shows a graph from 2001 to 2015 of Heavily indebted poor countries (HIPC). No data until 2000. Number of actual observations by date: 15.
Source name:
World Development Indicators
Source organization:
United Nations Educational, Scientific, and Cultural Organization (UNESCO) Institute for Statistics.
Categories, topics:
Education, Gender
Last updated:
apr 23, 2017
Indicators value changes by year
Minimum:
74.833
jan 1, 2011
Maximum:
91.714
jan 1, 2001
At the date of observation
Value
Absolute change
Change from previous value
jan 1, 2001
91.714
+91.714
0.0%
jan 1, 2002
90.228
-1.486
-1.62%
jan 1, 2003
87.221
-3.007
-3.33%
jan 1, 2004
86.696
-0.525
-0.6%
jan 1, 2005
85.654
-1.042
-1.2%
jan 1, 2006
85.374
-0.28
-0.33%
jan 1, 2007
84.357
-1.017
-1.19%
jan 1, 2008
84.597
+0.24
0.28%
jan 1, 2009
81.212
-3.386
-4.0%
jan 1, 2010
81.239
+0.027
0.03%
jan 1, 2011
74.833
-6.405
-7.88%
jan 1, 2012
75.813
+0.979
1.31%
jan 1, 2013
76.467
+0.655
0.86%
jan 1, 2014
76.715
+0.247
0.32%
jan 1, 2015
76.043
-0.672
-0.88%
Ranking of countries by current statistics by years


Comments: