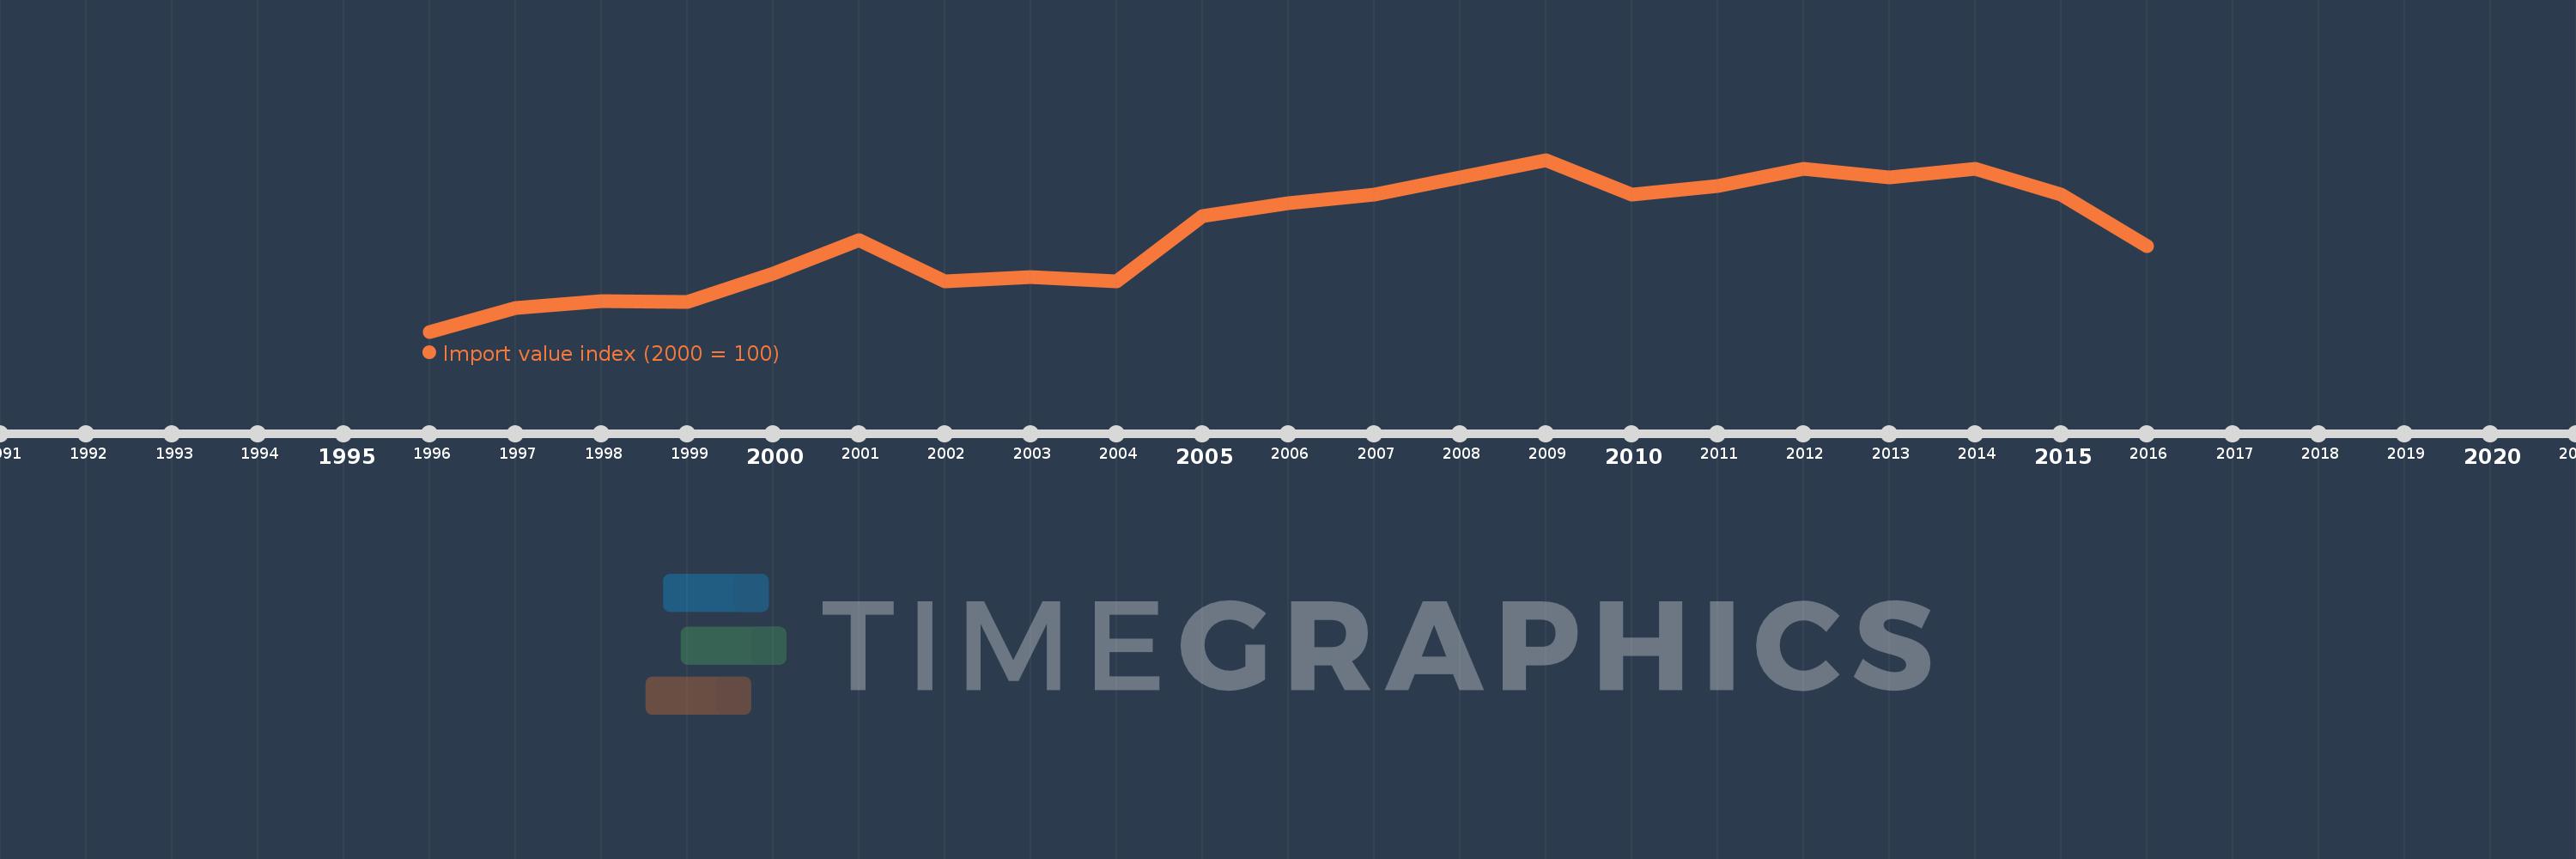
This timeline shows a graph from 1996 to 2016 of British Virgin Islands. No data until 1995. Number of actual observations by date: 21.
Source name:
World Development Indicators
Source organization:
United Nations Conference on Trade and Development, Handbook of Statistics and data files, and International Monetary Fund, International Financial Statistics.
Categories, topics:
Private Sector, Trade
Last updated:
apr 23, 2017
Indicators value changes by year
Meaning:
103.723
Minimum:
55.19
jan 1, 1996
Maximum:
139.241
jan 1, 2009
At the date of observation
Value
Absolute change
Change from the previous value
jan 1, 1996
55.19
+55.19
0.0%
jan 1, 1997
66.835
+11.646
21.1%
jan 1, 1998
70.211
+3.376
5.05%
jan 1, 1999
69.494
-0.717
-1.02%
jan 1, 2000
83.544
+14.051
20.22%
jan 1, 2001
100.0
+16.456
19.7%
jan 1, 2002
79.747
-20.253
-20.25%
jan 1, 2003
81.857
+2.11
2.65%
jan 1, 2004
79.747
-2.11
-2.58%
jan 1, 2005
111.814
+32.068
40.21%
jan 1, 2006
118.143
+6.329
5.66%
jan 1, 2007
122.363
+4.219
3.57%
jan 1, 2008
130.802
+8.439
6.9%
jan 1, 2009
139.241
+8.439
6.45%
jan 1, 2010
122.363
-16.878
-12.12%
jan 1, 2011
126.582
+4.219
3.45%
jan 1, 2012
135.021
+8.439
6.67%
jan 1, 2013
130.802
-4.219
-3.13%
jan 1, 2014
135.021
+4.219
3.23%
jan 1, 2015
122.363
-12.658
-9.38%
jan 1, 2016
97.046
-25.316
-20.69%
Ranking of countries by current statistics by years