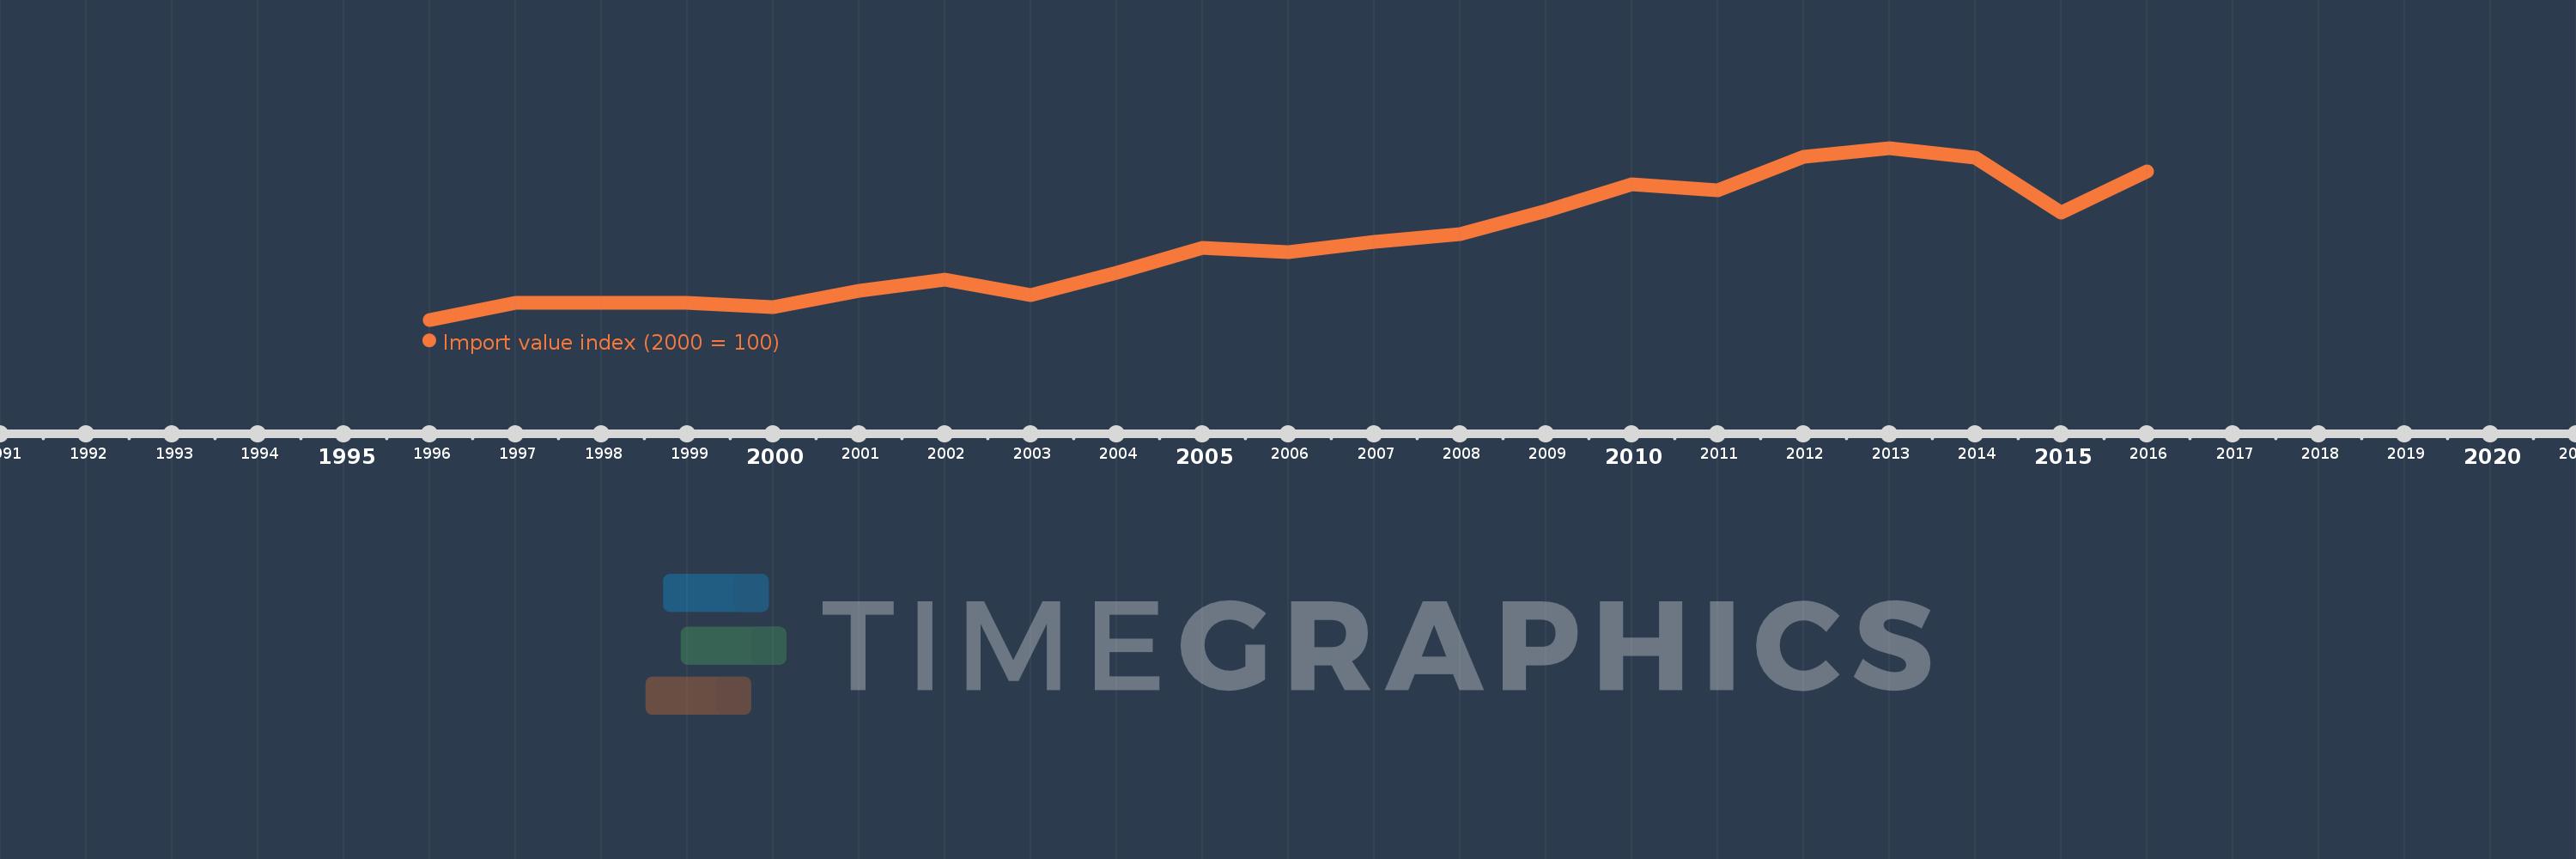
This timeline shows a graph from 1996 to 2016 of Micronesia, Fed. Sts.. No data until 1995. Number of actual observations by date: 21.
Source name:
World Development Indicators
Source organization:
United Nations Conference on Trade and Development, Handbook of Statistics and data files, and International Monetary Fund, International Financial Statistics.
Categories, topics:
Private Sector, Trade
Last updated:
apr 23, 2017
Indicators value changes by year
Meaning:
127.878
Minimum:
83.618
jan 1, 1996
Maximum:
181.383
jan 1, 2013
At the date of observation
Value
Absolute change
Change from the previous value
jan 1, 1996
83.618
+83.618
0.0%
jan 1, 1997
93.272
+9.653
11.54%
jan 1, 1998
93.111
-0.161
-0.17%
jan 1, 1999
93.471
+0.361
0.39%
jan 1, 2000
90.673
-2.798
-2.99%
jan 1, 2001
100.0
+9.327
10.29%
jan 1, 2002
106.626
+6.626
6.63%
jan 1, 2003
97.686
-8.94
-8.38%
jan 1, 2004
110.457
+12.771
13.07%
jan 1, 2005
124.294
+13.837
12.53%
jan 1, 2006
121.969
-2.325
-1.87%
jan 1, 2007
128.099
+6.13
5.03%
jan 1, 2008
132.57
+4.472
3.49%
jan 1, 2009
145.38
+12.81
9.66%
jan 1, 2010
160.846
+15.466
10.64%
jan 1, 2011
157.262
-3.584
-2.23%
jan 1, 2012
176.172
+18.91
12.02%
jan 1, 2013
181.383
+5.212
2.96%
jan 1, 2014
175.807
-5.576
-3.07%
jan 1, 2015
144.666
-31.142
-17.71%
jan 1, 2016
168.083
+23.417
16.19%
Ranking of countries by current statistics by years