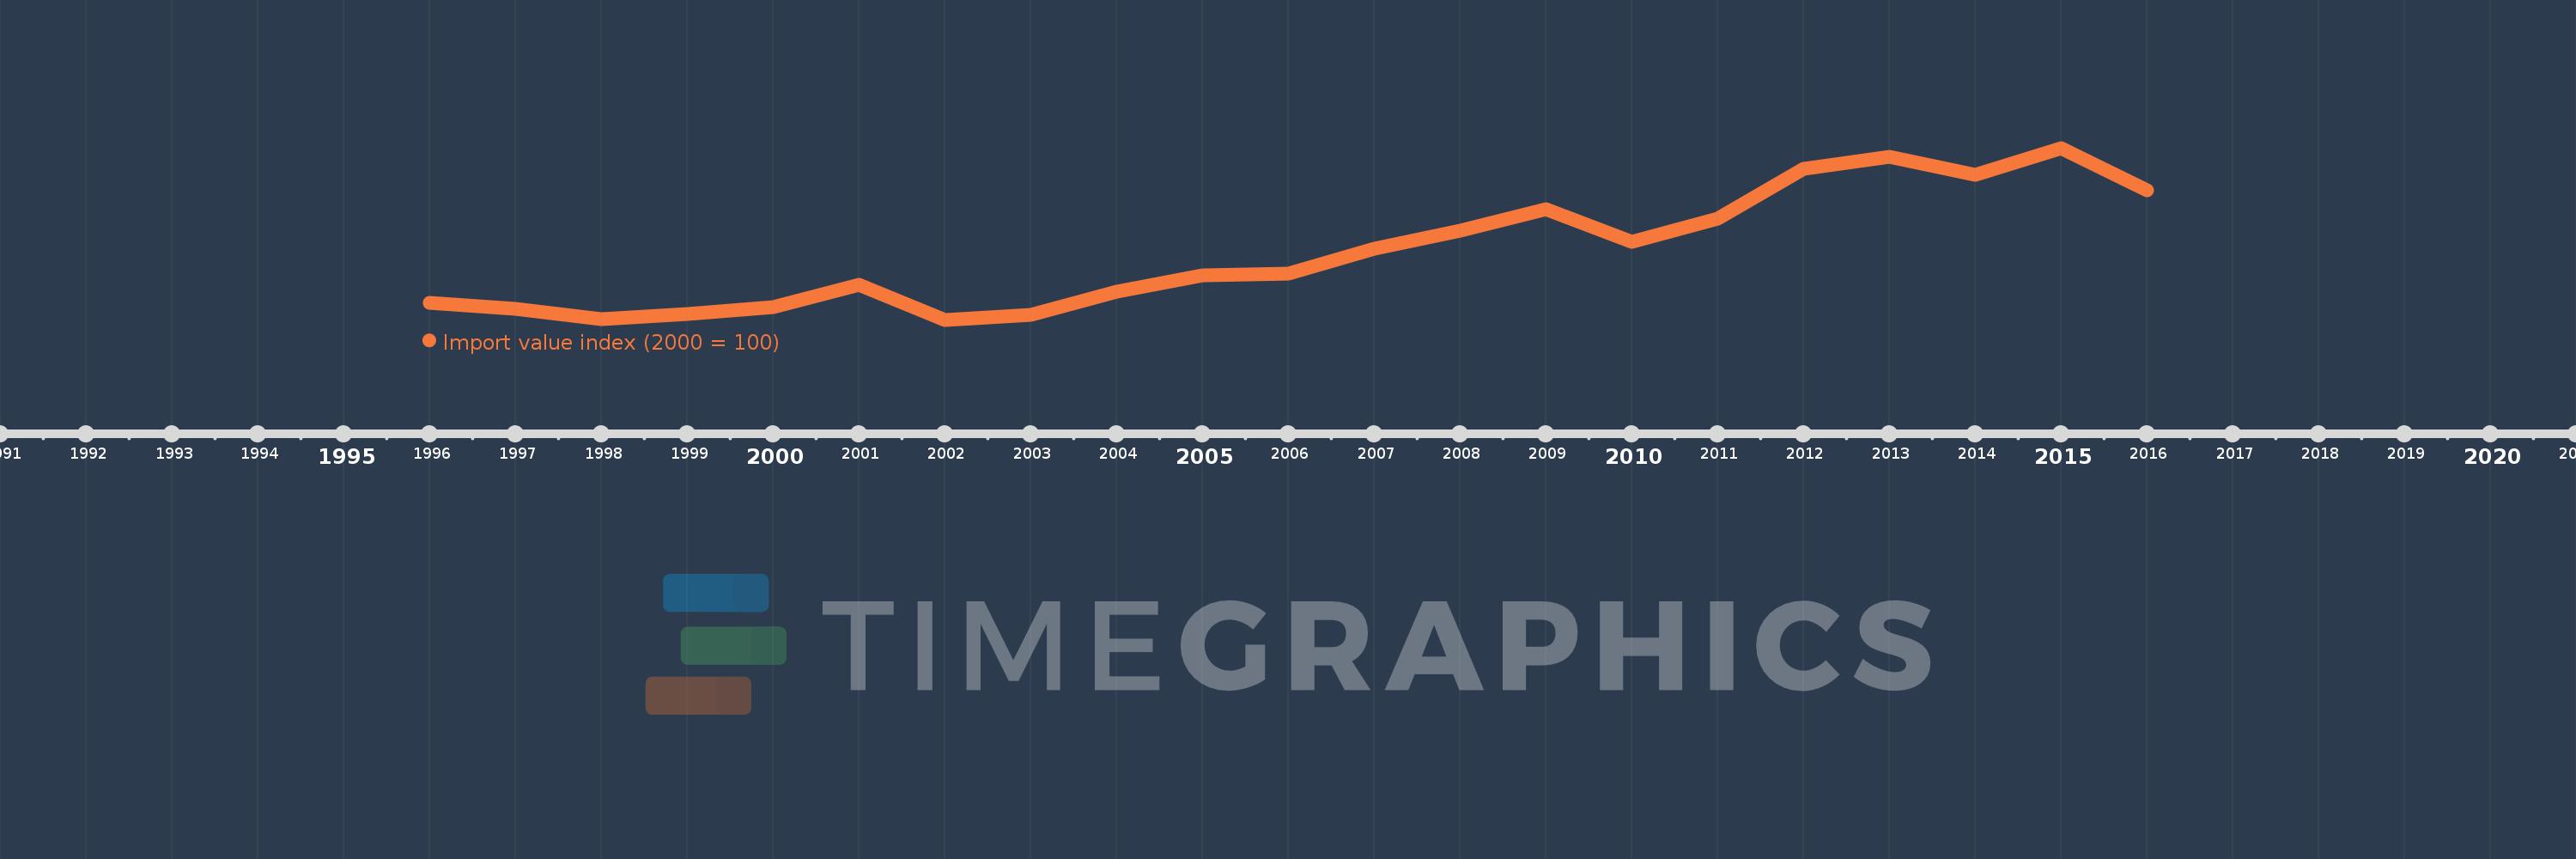
This timeline shows a graph from 1996 to 2016 of Malta. No data until 1995. Number of actual observations by date: 21.
Source name:
World Development Indicators
Source organization:
United Nations Conference on Trade and Development, Handbook of Statistics and data files, and International Monetary Fund, International Financial Statistics.
Categories, topics:
Private Sector, Trade
Last updated:
apr 23, 2017
Indicators value changes by year
Meaning:
123.419
Minimum:
74.151
jan 1, 2002
Maximum:
199.733
jan 1, 2015
At the date of observation
Value
Absolute change
Change from the previous value
jan 1, 1996
86.228
+86.228
0.0%
jan 1, 1997
81.892
-4.336
-5.03%
jan 1, 1998
74.759
-7.133
-8.71%
jan 1, 1999
78.153
+3.393
4.54%
jan 1, 2000
83.285
+5.133
6.57%
jan 1, 2001
100.0
+16.715
20.07%
jan 1, 2002
74.151
-25.849
-25.85%
jan 1, 2003
77.525
+3.374
4.55%
jan 1, 2004
94.548
+17.023
21.96%
jan 1, 2005
106.655
+12.107
12.8%
jan 1, 2006
107.828
+1.173
1.1%
jan 1, 2007
126.178
+18.349
17.02%
jan 1, 2008
139.45
+13.273
10.52%
jan 1, 2009
155.273
+15.823
11.35%
jan 1, 2010
131.175
-24.098
-15.52%
jan 1, 2011
148.296
+17.121
13.05%
jan 1, 2012
184.343
+36.047
24.31%
jan 1, 2013
193.291
+8.949
4.85%
jan 1, 2014
179.947
-13.344
-6.9%
jan 1, 2015
199.733
+19.786
11.0%
jan 1, 2016
169.086
-30.647
-15.34%
Ranking of countries by current statistics by years