33
/
AIzaSyAYiBZKx7MnpbEhh9jyipgxe19OcubqV5w
August 1, 2025
273707
Ukraine
UKR
true
2
1
Import value index (2000 = 100)
2016,2015,2014,2013,2012,2011,2010,2009,2008,2007,2006,2005,2004,2003,2002,2001,2000,1999,1998,1997,1996
Download
Global statistics library →Ukraine →

Import value index (2000 = 100)

This statistics in other country:

AfghanistanAlbaniaAlgeriaAmerican SamoaAndorraAngolaAntigua and BarbudaArgentinaArmeniaArubaAustraliaAustriaAzerbaijanBahamas, TheBahrainBangladeshBarbadosBelarusBelgiumBelizeBeninBermudaBhutanBoliviaBosnia and HerzegovinaBotswanaBrazilBritish Virgin IslandsBrunei DarussalamBulgariaBurkina FasoBurundiCabo VerdeCambodiaCameroonCanadaCayman IslandsCentral African RepublicChadChileChinaColombiaComorosCongo, Dem. Rep.Congo, Rep.Costa RicaCote d'IvoireCroatiaCubaCuracaoCyprusCzech RepublicDenmarkDjiboutiDominicaDominican RepublicEcuadorEgypt, Arab Rep.El SalvadorEquatorial GuineaEritreaEstoniaEthiopiaFaroe IslandsFijiFinlandFranceFrench PolynesiaGabonGambia, TheGeorgiaGermanyGhanaGibraltarGreeceGreenlandGrenadaGuamGuatemalaGuineaGuinea-BissauGuyanaHaitiHondurasHong Kong SAR, ChinaHungaryIcelandIndiaIndonesiaIran, Islamic Rep.IraqIrelandIsraelItalyJamaicaJapanJordanKazakhstanKenyaKiribatiKorea, Dem. People’s Rep.Korea, Rep.KuwaitKyrgyz RepublicLao PDRLatviaLebanonLesothoLiberiaLibyaLithuaniaLuxembourgMacao SAR, ChinaMacedonia, FYRMadagascarMalawiMalaysiaMaldivesMaliMaltaMarshall IslandsMauritaniaMauritiusMexicoMicronesia, Fed. Sts.MoldovaMongoliaMoroccoMozambiqueMyanmarNamibiaNauruNepalNetherlandsNew CaledoniaNew ZealandNicaraguaNigerNigeriaNorthern Mariana IslandsNorwayOmanPakistanPalauPanamaPapua New GuineaParaguayPeruPhilippinesPolandPortugalQatarRomaniaRussian FederationRwandaSamoaSao Tome and PrincipeSaudi ArabiaSenegalSerbiaSeychellesSierra LeoneSingaporeSlovak RepublicSloveniaSolomon IslandsSomaliaSouth AfricaSpainSri LankaSt. Kitts and NevisSt. LuciaSt. Vincent and the GrenadinesSudanSurinameSwazilandSwedenSwitzerlandSyrian Arab RepublicTajikistanTanzaniaThailandTogoTongaTrinidad and TobagoTunisiaTurkeyTurkmenistanTurks and Caicos IslandsUgandaUkraineUnited Arab EmiratesUnited KingdomUnited StatesUruguayUzbekistanVanuatuVenezuela, RBVietnamWest Bank and GazaYemen, Rep.ZambiaZimbabwe

Timeline:

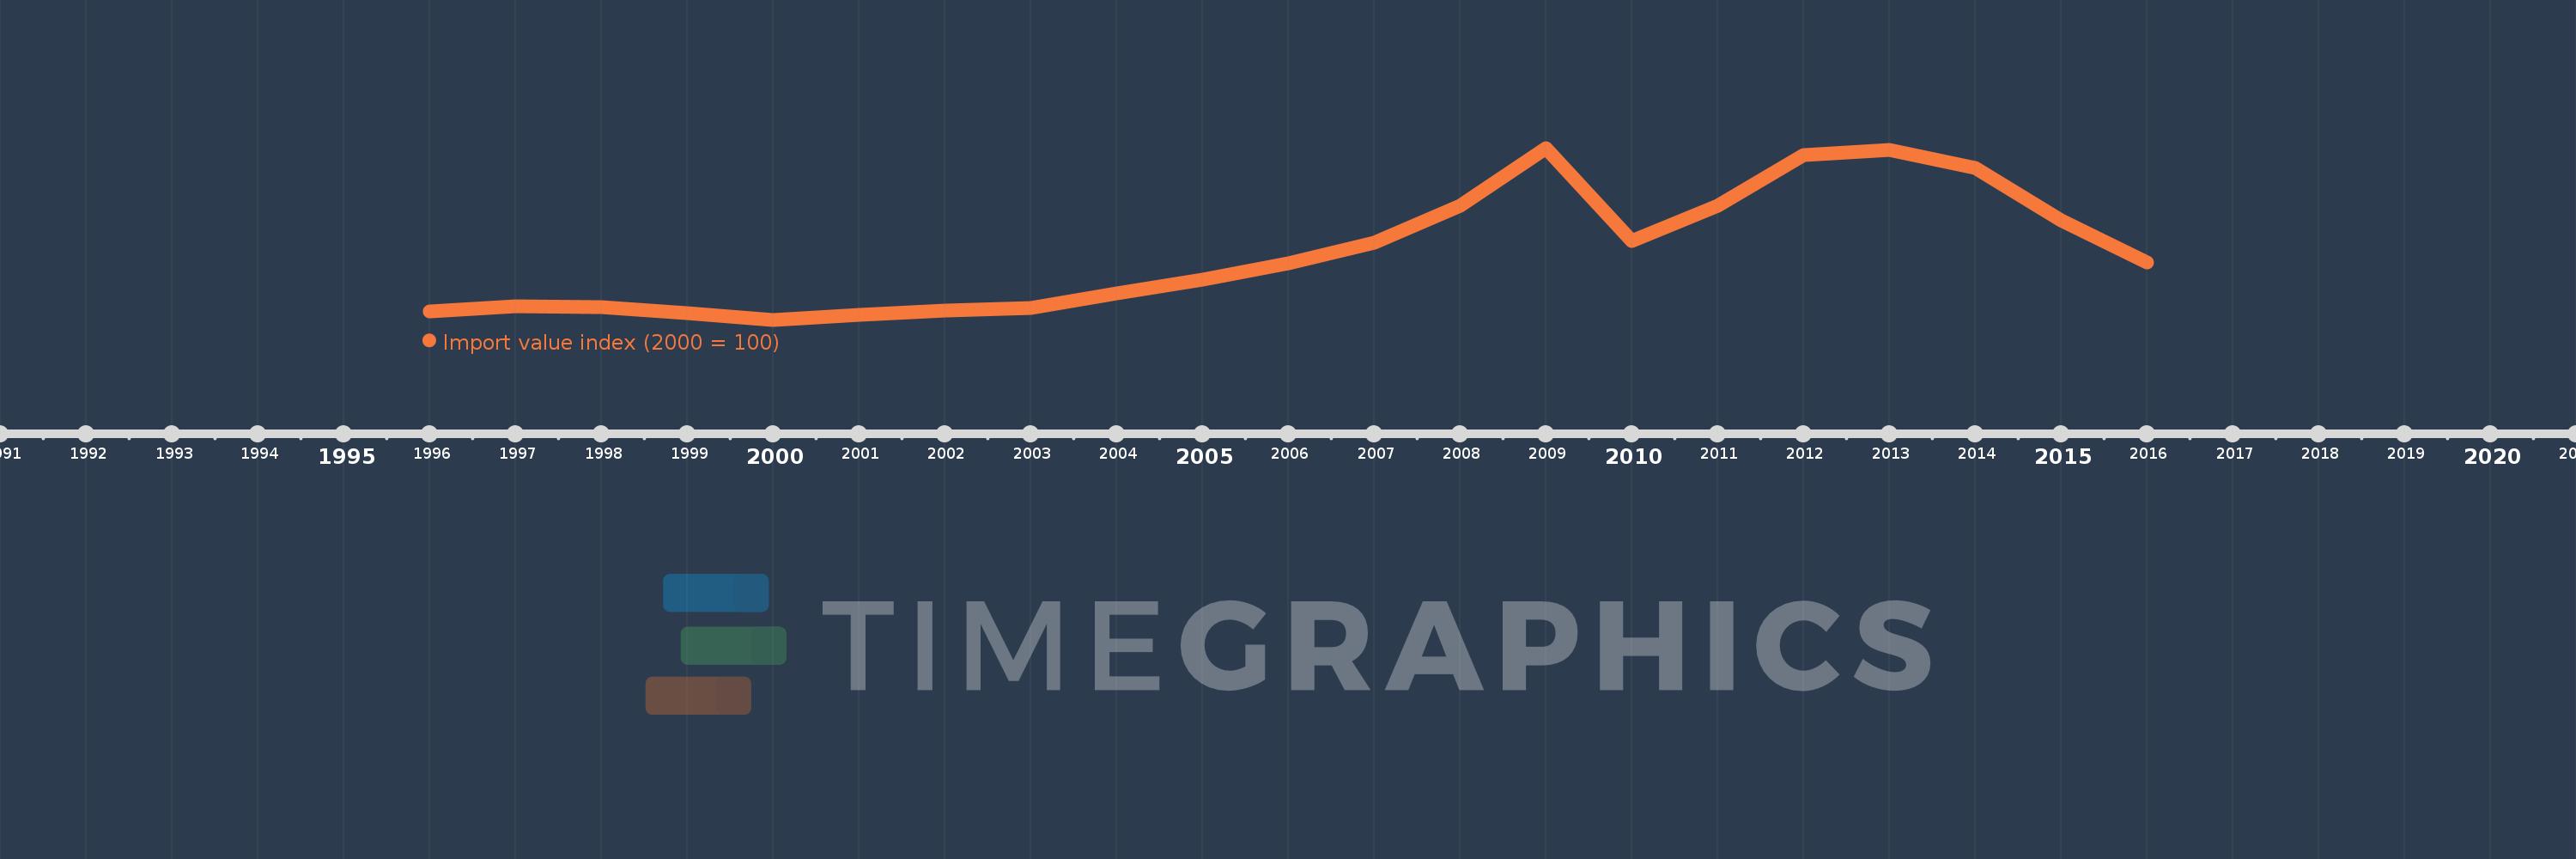
This timeline shows a graph from 1996 to 2016 of Ukraine. No data until 1995. Number of actual observations by date: 21.

Source name:

World Development Indicators

Source organization:

United Nations Conference on Trade and Development, Handbook of Statistics and data files, and International Monetary Fund, International Financial Statistics.

Categories, topics:

Private Sector, Trade

Last updated:

apr 23, 2017

Indicators value changes by year

Meaning:
287.93
Minimum:
84.881
jan 1, 2000
Maximum:
612.893
jan 1, 2009
At the date of observation
Value
Absolute change
Change from the previous value
jan 1, 1996
110.949
+110.949
0.0%
jan 1, 1997
126.132
+15.183
13.69%
jan 1, 1998
122.729
-3.404
-2.7%
jan 1, 1999
105.159
-17.57
-14.32%
jan 1, 2000
84.881
-20.278
-19.28%
jan 1, 2001
100.0
+15.119
17.81%
jan 1, 2002
113.034
+13.034
13.03%
jan 1, 2003
121.645
+8.611
7.62%
jan 1, 2004
164.948
+43.303
35.6%
jan 1, 2005
207.773
+42.825
25.96%
jan 1, 2006
258.93
+51.157
24.62%
jan 1, 2007
322.719
+63.788
24.64%
jan 1, 2008
434.351
+111.632
34.59%
jan 1, 2009
612.893
+178.542
41.11%
jan 1, 2010
325.931
-286.961
-46.82%
jan 1, 2011
436.45
+110.519
33.91%
jan 1, 2012
591.817
+155.367
35.6%
jan 1, 2013
606.47
+14.653
2.48%
jan 1, 2014
550.208
-56.263
-9.28%
jan 1, 2015
389.295
-160.913
-29.25%
jan 1, 2016
260.226
-129.069
-33.15%

Ranking of countries by current statistics by years