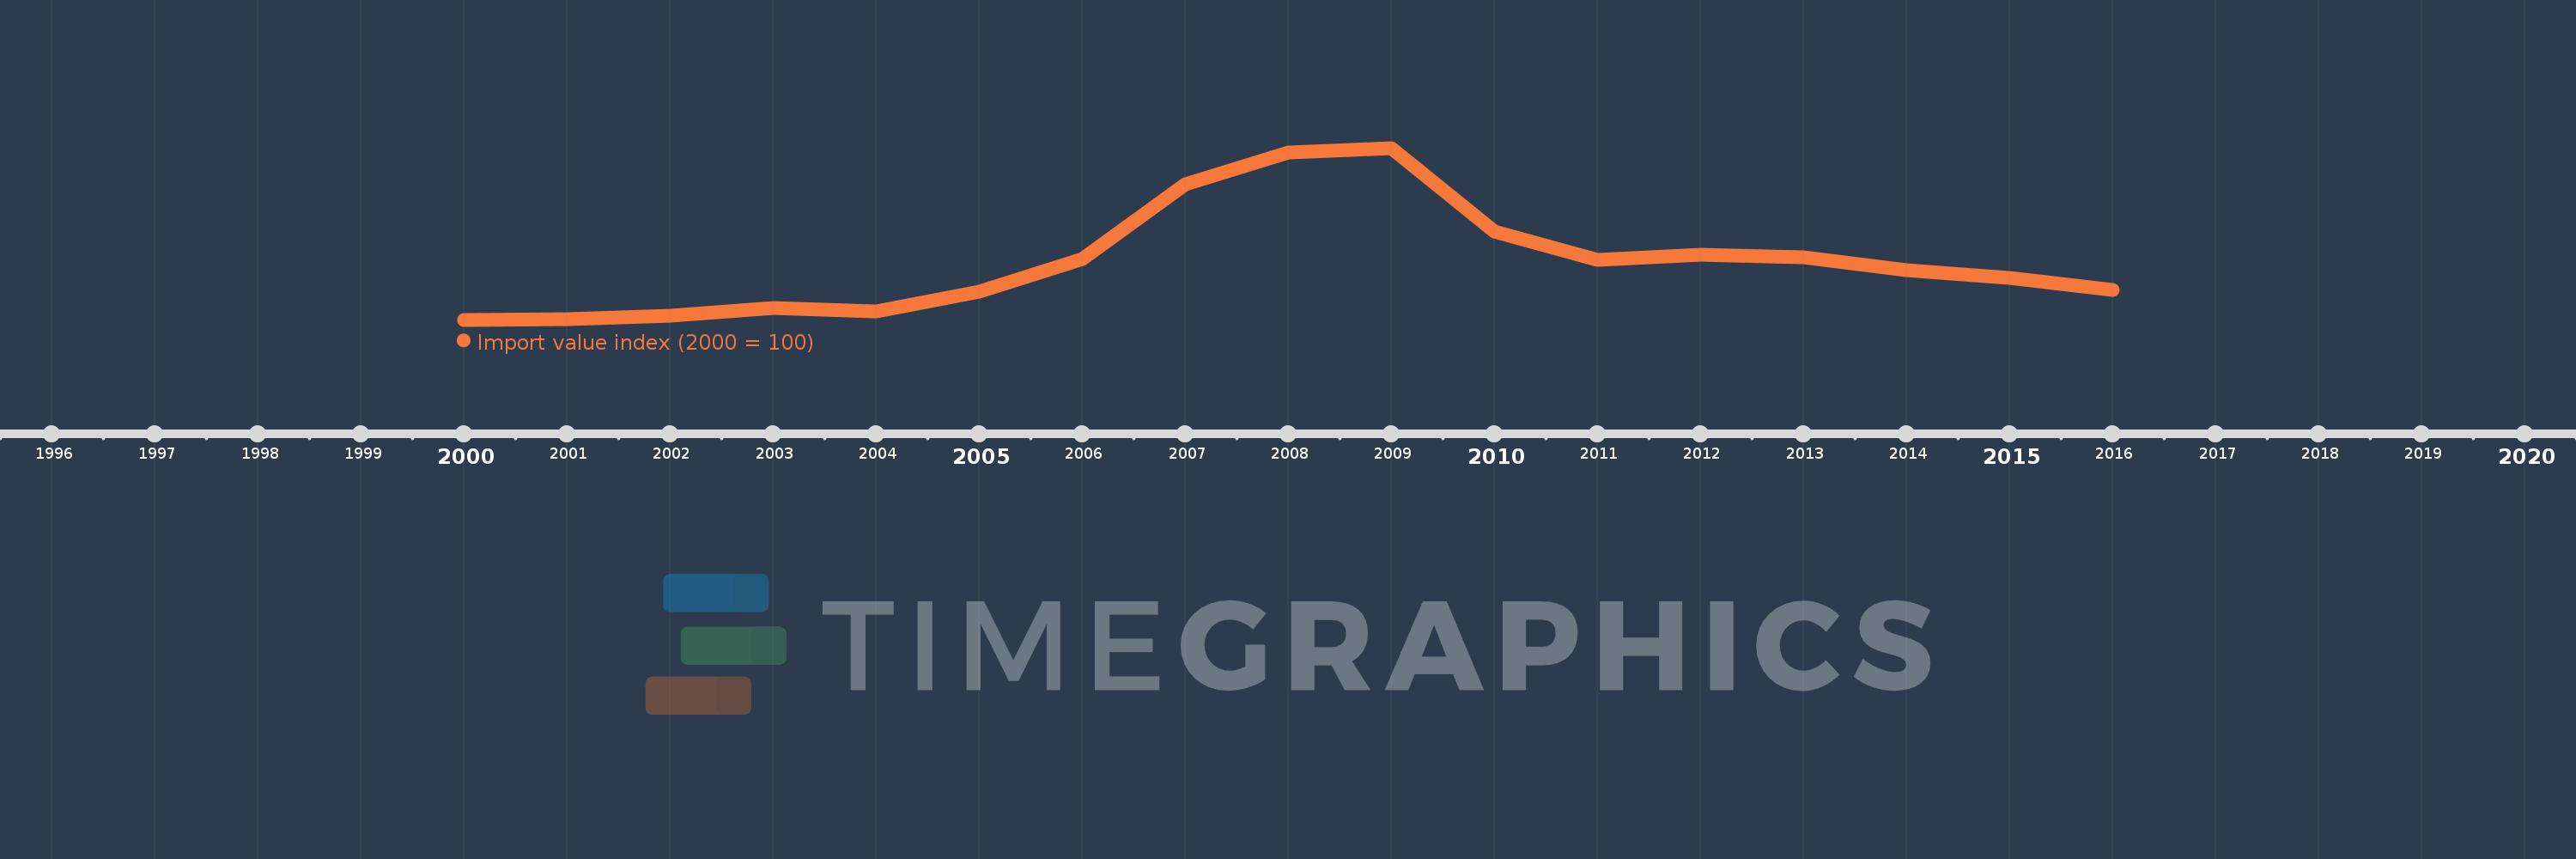
This timeline shows a graph from 2000 to 2016 of Turks and Caicos Islands. No data until 1999. Number of actual observations by date: 17.
Source name:
World Development Indicators
Source organization:
United Nations Conference on Trade and Development, Handbook of Statistics and data files, and International Monetary Fund, International Financial Statistics.
Categories, topics:
Private Sector, Trade
Last updated:
apr 23, 2017
Indicators value changes by year
Meaning:
199.8
Minimum:
99.122
jan 1, 2000
Maximum:
397.693
jan 1, 2009
At the date of observation
Value
Absolute change
Change from the previous value
jan 1, 2000
99.122
+99.122
0.0%
jan 1, 2001
100.0
+0.878
0.89%
jan 1, 2002
105.436
+5.436
5.44%
jan 1, 2003
119.281
+13.845
13.13%
jan 1, 2004
113.58
-5.701
-4.78%
jan 1, 2005
148.384
+34.804
30.64%
jan 1, 2006
204.291
+55.907
37.68%
jan 1, 2007
334.808
+130.517
63.89%
jan 1, 2008
390.524
+55.716
16.64%
jan 1, 2009
397.693
+7.169
1.84%
jan 1, 2010
252.501
-145.193
-36.51%
jan 1, 2011
203.134
-49.367
-19.55%
jan 1, 2012
212.527
+9.393
4.62%
jan 1, 2013
208.104
-4.422
-2.08%
jan 1, 2014
184.943
-23.161
-11.13%
jan 1, 2015
171.152
-13.792
-7.46%
jan 1, 2016
151.114
-20.038
-11.71%
Ranking of countries by current statistics by years