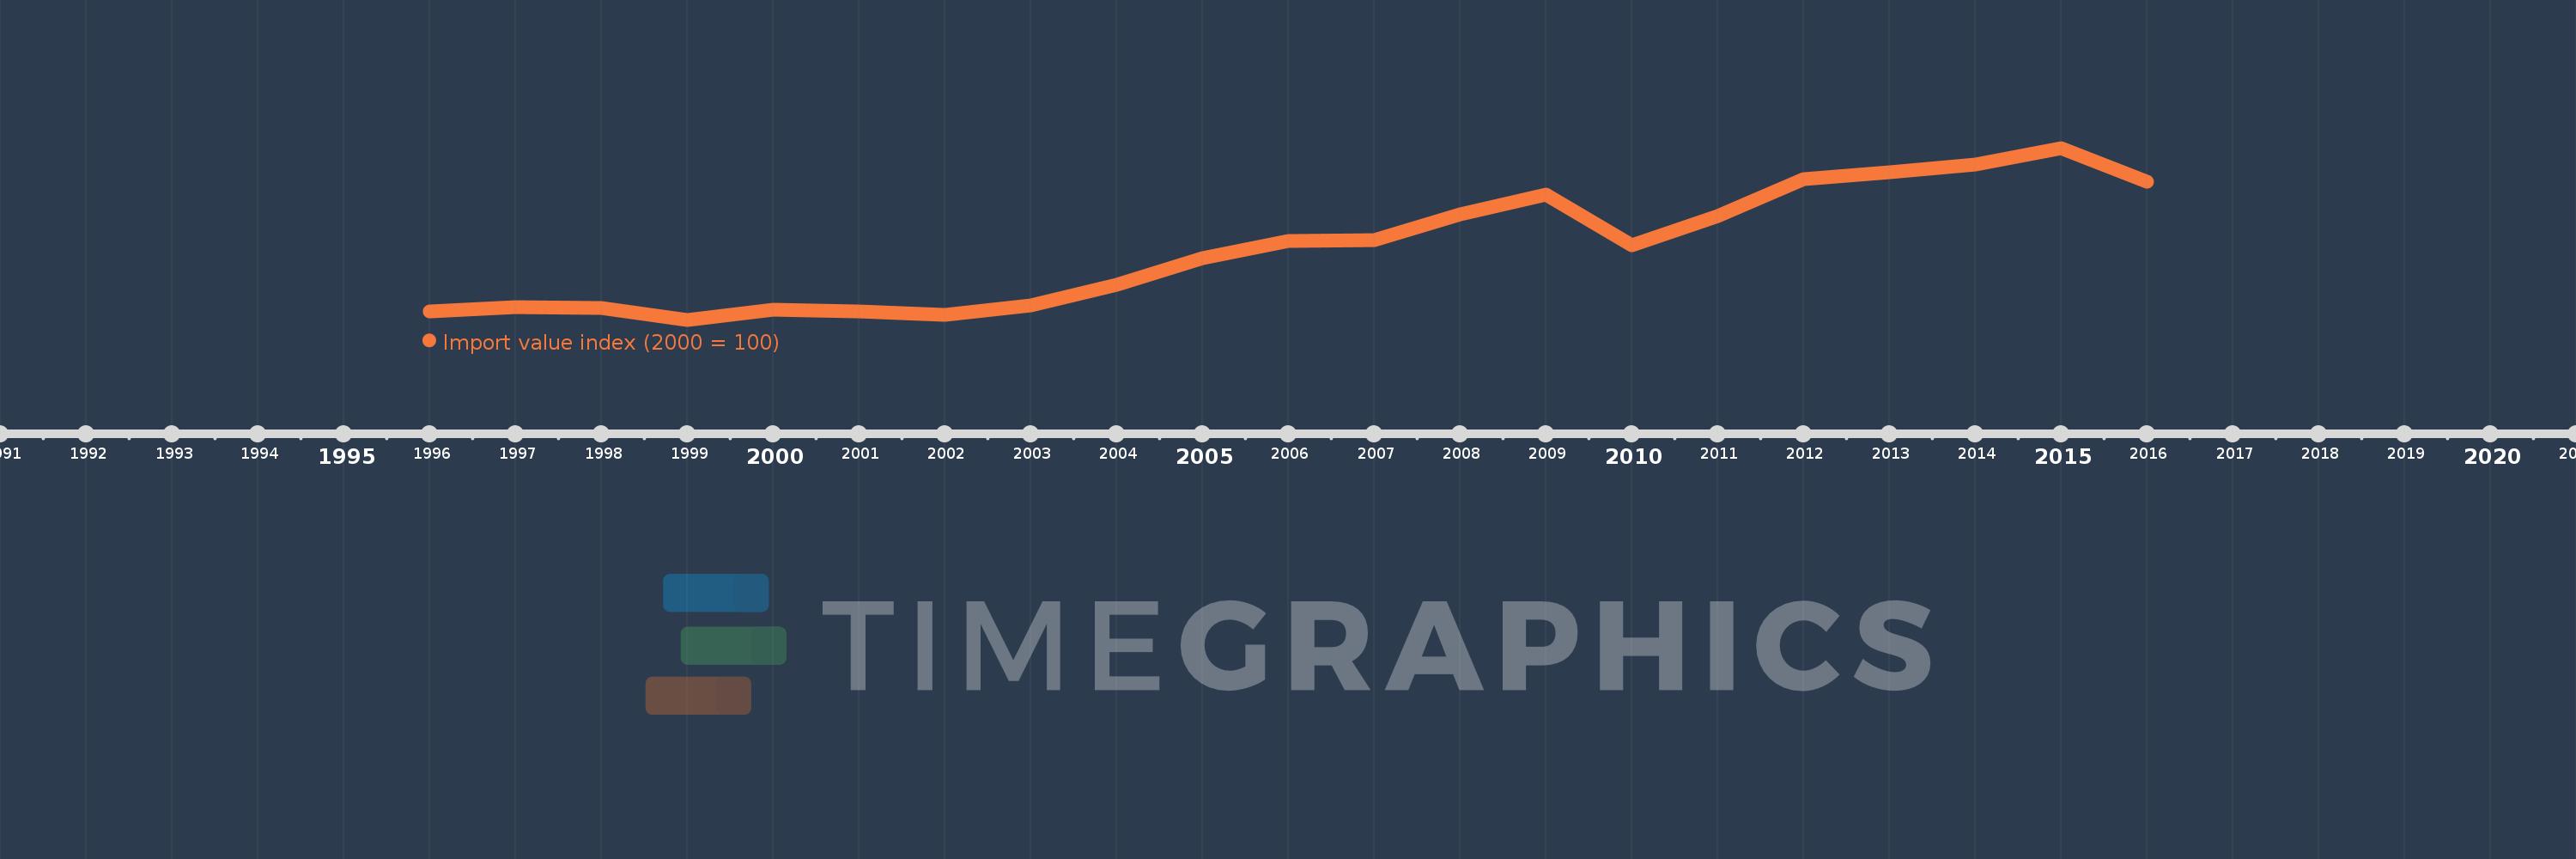
This timeline shows a graph from 1996 to 2016 of New Zealand. No data until 1995. Number of actual observations by date: 21.
Source name:
World Development Indicators
Source organization:
United Nations Conference on Trade and Development, Handbook of Statistics and data files, and International Monetary Fund, International Financial Statistics.
Categories, topics:
Private Sector, Trade
Last updated:
apr 23, 2017
Indicators value changes by year
Meaning:
178.838
Minimum:
89.869
jan 1, 1999
Maximum:
305.792
jan 1, 2015
At the date of observation
Value
Absolute change
Change from the previous value
jan 1, 1996
100.378
+100.378
0.0%
jan 1, 1997
105.895
+5.517
5.5%
jan 1, 1998
104.418
-1.477
-1.39%
jan 1, 1999
89.869
-14.549
-13.93%
jan 1, 2000
102.977
+13.108
14.59%
jan 1, 2001
100.0
-2.977
-2.89%
jan 1, 2002
95.711
-4.289
-4.29%
jan 1, 2003
108.218
+12.507
13.07%
jan 1, 2004
133.476
+25.258
23.34%
jan 1, 2005
166.818
+33.342
24.98%
jan 1, 2006
188.569
+21.751
13.04%
jan 1, 2007
190.043
+1.474
0.78%
jan 1, 2008
222.102
+32.06
16.87%
jan 1, 2009
247.183
+25.081
11.29%
jan 1, 2010
183.926
-63.257
-25.59%
jan 1, 2011
220.195
+36.269
19.72%
jan 1, 2012
266.857
+46.662
21.19%
jan 1, 2013
275.119
+8.262
3.1%
jan 1, 2014
285.096
+9.977
3.63%
jan 1, 2015
305.792
+20.696
7.26%
jan 1, 2016
262.962
-42.83
-14.01%
Ranking of countries by current statistics by years