33
/
AIzaSyAYiBZKx7MnpbEhh9jyipgxe19OcubqV5w
May 1, 2025
214423
Norway
NOR
true
2
1
Import value index (2000 = 100)
2016,2015,2014,2013,2012,2011,2010,2009,2008,2007,2006,2005,2004,2003,2002,2001,2000,1999,1998,1997,1996
Download
Global statistics library →Norway →

Import value index (2000 = 100)

This statistics in other country:

AfghanistanAlbaniaAlgeriaAmerican SamoaAndorraAngolaAntigua and BarbudaArgentinaArmeniaArubaAustraliaAustriaAzerbaijanBahamas, TheBahrainBangladeshBarbadosBelarusBelgiumBelizeBeninBermudaBhutanBoliviaBosnia and HerzegovinaBotswanaBrazilBritish Virgin IslandsBrunei DarussalamBulgariaBurkina FasoBurundiCabo VerdeCambodiaCameroonCanadaCayman IslandsCentral African RepublicChadChileChinaColombiaComorosCongo, Dem. Rep.Congo, Rep.Costa RicaCote d'IvoireCroatiaCubaCuracaoCyprusCzech RepublicDenmarkDjiboutiDominicaDominican RepublicEcuadorEgypt, Arab Rep.El SalvadorEquatorial GuineaEritreaEstoniaEthiopiaFaroe IslandsFijiFinlandFranceFrench PolynesiaGabonGambia, TheGeorgiaGermanyGhanaGibraltarGreeceGreenlandGrenadaGuamGuatemalaGuineaGuinea-BissauGuyanaHaitiHondurasHong Kong SAR, ChinaHungaryIcelandIndiaIndonesiaIran, Islamic Rep.IraqIrelandIsraelItalyJamaicaJapanJordanKazakhstanKenyaKiribatiKorea, Dem. People’s Rep.Korea, Rep.KuwaitKyrgyz RepublicLao PDRLatviaLebanonLesothoLiberiaLibyaLithuaniaLuxembourgMacao SAR, ChinaMacedonia, FYRMadagascarMalawiMalaysiaMaldivesMaliMaltaMarshall IslandsMauritaniaMauritiusMexicoMicronesia, Fed. Sts.MoldovaMongoliaMoroccoMozambiqueMyanmarNamibiaNauruNepalNetherlandsNew CaledoniaNew ZealandNicaraguaNigerNigeriaNorthern Mariana IslandsNorwayOmanPakistanPalauPanamaPapua New GuineaParaguayPeruPhilippinesPolandPortugalQatarRomaniaRussian FederationRwandaSamoaSao Tome and PrincipeSaudi ArabiaSenegalSerbiaSeychellesSierra LeoneSingaporeSlovak RepublicSloveniaSolomon IslandsSomaliaSouth AfricaSpainSri LankaSt. Kitts and NevisSt. LuciaSt. Vincent and the GrenadinesSudanSurinameSwazilandSwedenSwitzerlandSyrian Arab RepublicTajikistanTanzaniaThailandTogoTongaTrinidad and TobagoTunisiaTurkeyTurkmenistanTurks and Caicos IslandsUgandaUkraineUnited Arab EmiratesUnited KingdomUnited StatesUruguayUzbekistanVanuatuVenezuela, RBVietnamWest Bank and GazaYemen, Rep.ZambiaZimbabwe

Timeline:

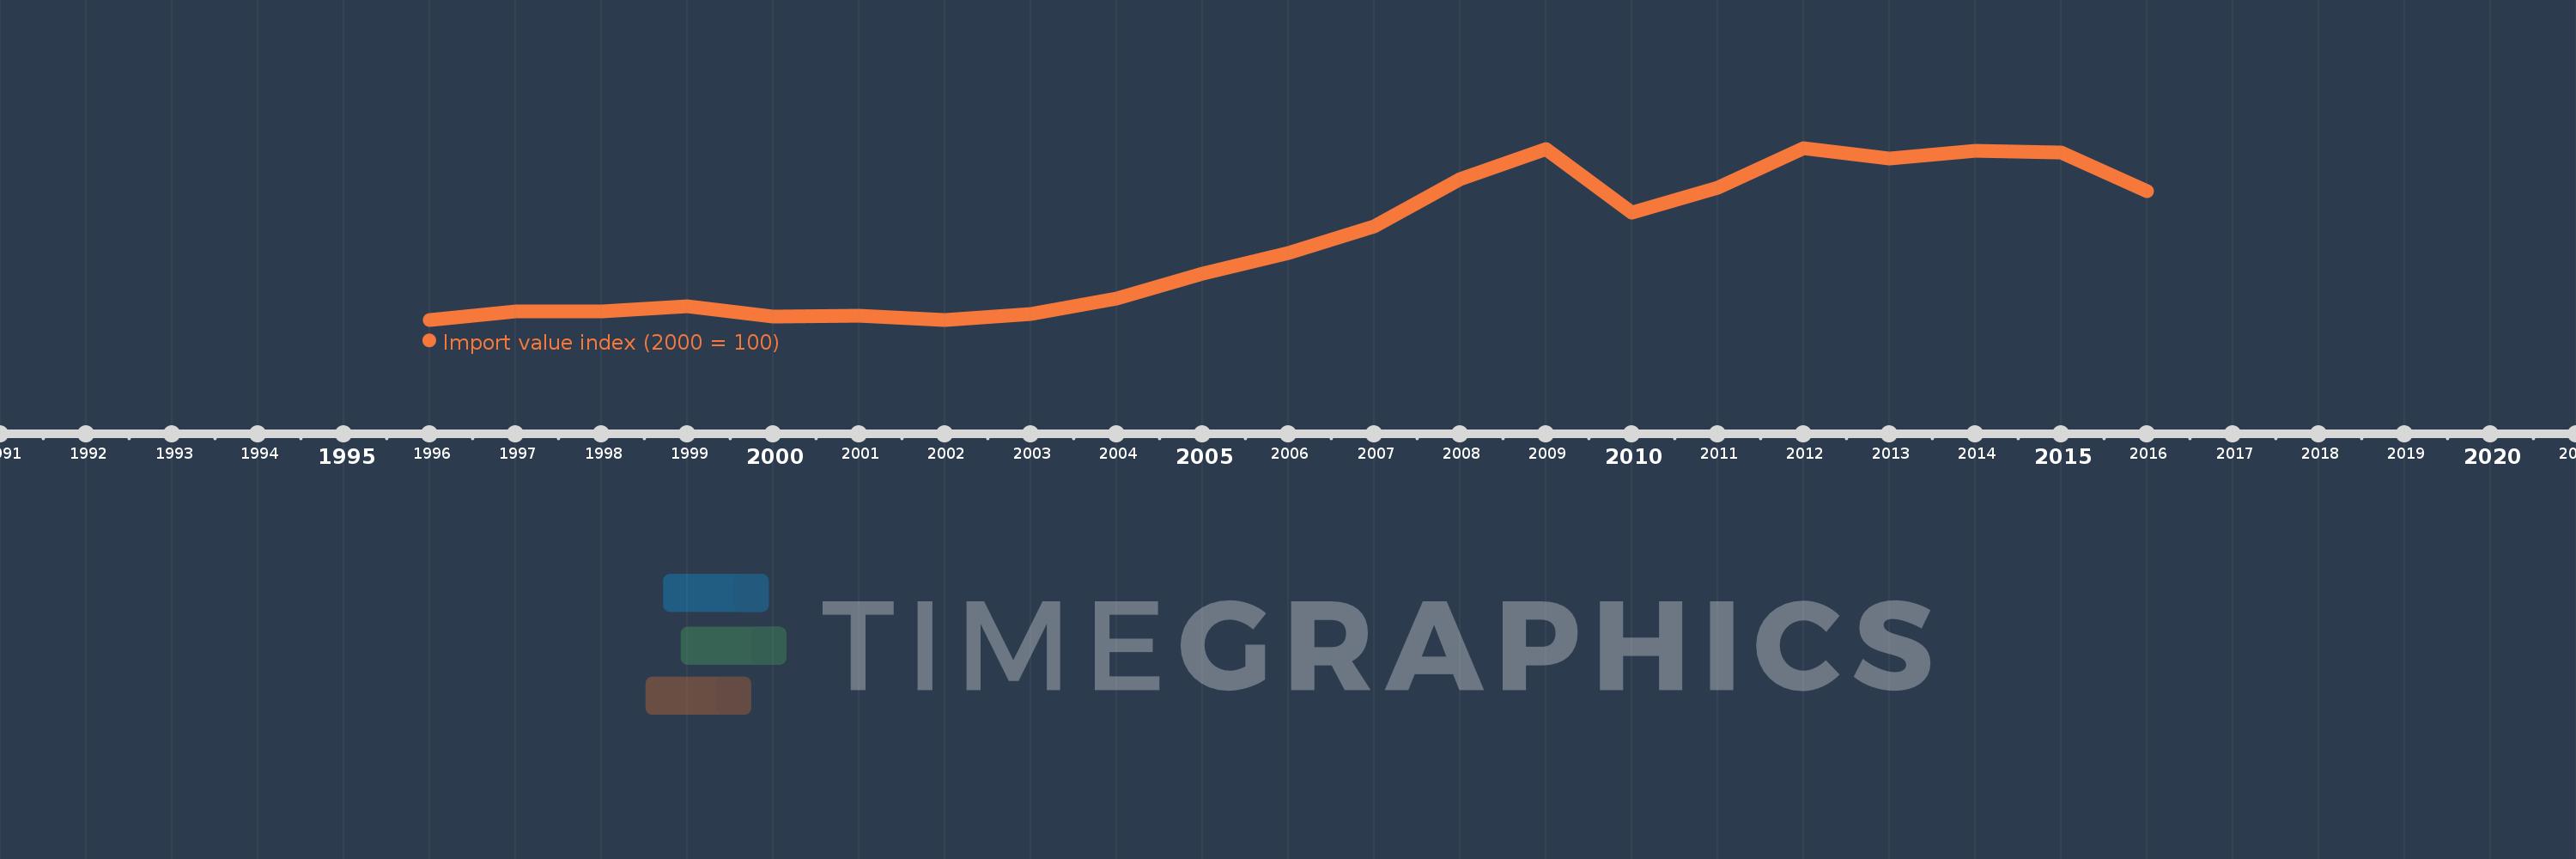
This timeline shows a graph from 1996 to 2016 of Norway. No data until 1995. Number of actual observations by date: 21.

Source name:

World Development Indicators

Source organization:

United Nations Conference on Trade and Development, Handbook of Statistics and data files, and International Monetary Fund, International Financial Statistics.

Categories, topics:

Private Sector, Trade

Last updated:

apr 23, 2017

Indicators value changes by year

Meaning:
171.236
Minimum:
95.824
jan 1, 2002
Maximum:
263.974
jan 1, 2012
At the date of observation
Value
Absolute change
Change from the previous value
jan 1, 1996
95.863
+95.863
0.0%
jan 1, 1997
103.56
+7.697
8.03%
jan 1, 1998
103.832
+0.272
0.26%
jan 1, 1999
108.961
+5.13
4.94%
jan 1, 2000
99.345
-9.616
-8.83%
jan 1, 2001
100.0
+0.655
0.66%
jan 1, 2002
95.824
-4.176
-4.18%
jan 1, 2003
101.401
+5.577
5.82%
jan 1, 2004
116.469
+15.068
14.86%
jan 1, 2005
141.124
+24.655
21.17%
jan 1, 2006
161.345
+20.221
14.33%
jan 1, 2007
186.853
+25.509
15.81%
jan 1, 2008
233.483
+46.63
24.96%
jan 1, 2009
262.548
+29.065
12.45%
jan 1, 2010
200.546
-62.002
-23.62%
jan 1, 2011
224.855
+24.309
12.12%
jan 1, 2012
263.974
+39.119
17.4%
jan 1, 2013
253.867
-10.106
-3.83%
jan 1, 2014
261.137
+7.27
2.86%
jan 1, 2015
259.326
-1.811
-0.69%
jan 1, 2016
221.651
-37.676
-14.53%

Ranking of countries by current statistics by years