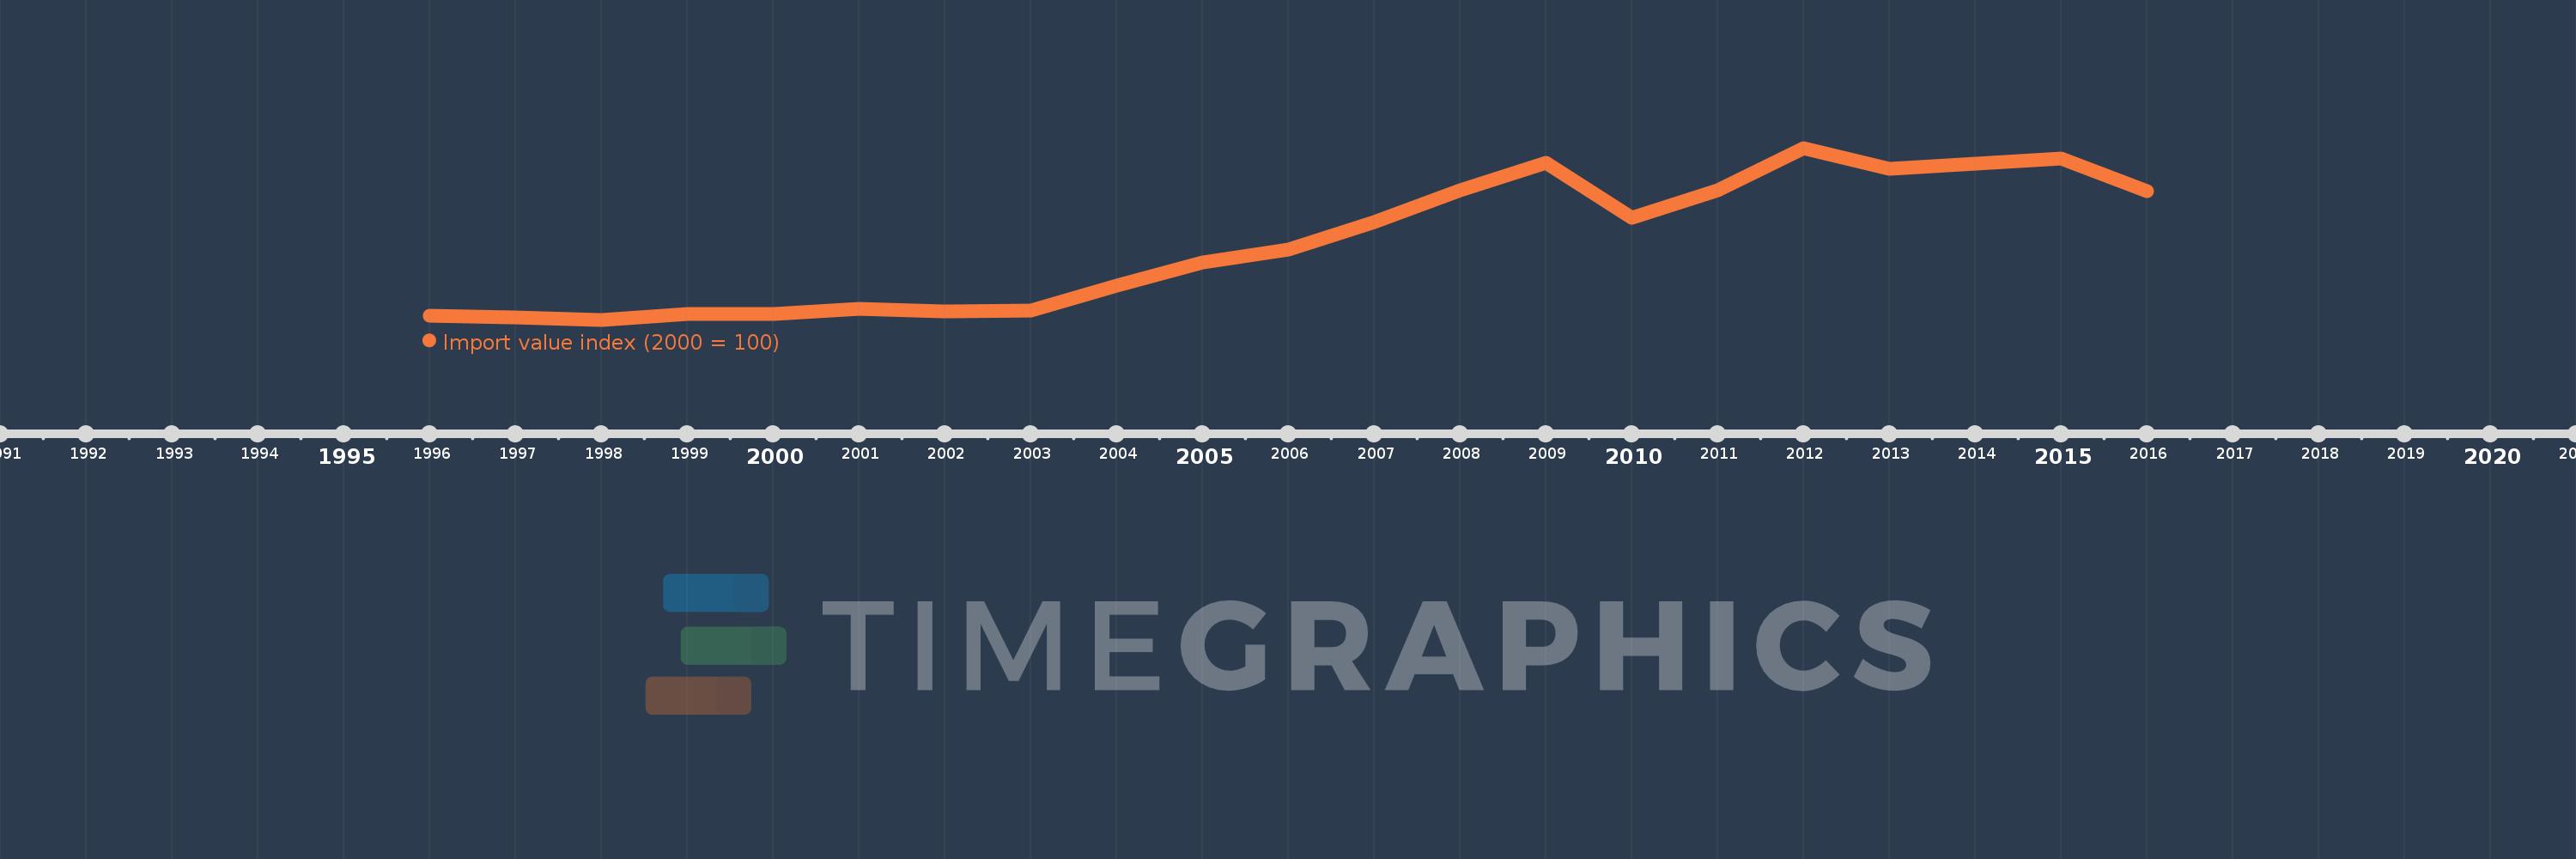
This timeline shows a graph from 1996 to 2016 of Germany. No data until 1995. Number of actual observations by date: 21.
Source name:
World Development Indicators
Source organization:
United Nations Conference on Trade and Development, Handbook of Statistics and data files, and International Monetary Fund, International Financial Statistics.
Categories, topics:
Private Sector, Trade
Last updated:
apr 23, 2017
Indicators value changes by year
Meaning:
161.87
Minimum:
89.876
jan 1, 1998
Maximum:
253.013
jan 1, 2012
At the date of observation
Value
Absolute change
Change from the previous value
jan 1, 1996
93.535
+93.535
0.0%
jan 1, 1997
92.439
-1.096
-1.17%
jan 1, 1998
89.876
-2.563
-2.77%
jan 1, 1999
94.969
+5.093
5.67%
jan 1, 2000
95.669
+0.701
0.74%
jan 1, 2001
100.0
+4.331
4.53%
jan 1, 2002
98.014
-1.986
-1.99%
jan 1, 2003
98.853
+0.839
0.86%
jan 1, 2004
121.905
+23.052
23.32%
jan 1, 2005
144.312
+22.406
18.38%
jan 1, 2006
156.677
+12.366
8.57%
jan 1, 2007
182.81
+26.133
16.68%
jan 1, 2008
212.711
+29.901
16.36%
jan 1, 2009
238.939
+26.228
12.33%
jan 1, 2010
186.775
-52.164
-21.83%
jan 1, 2011
212.677
+25.902
13.87%
jan 1, 2012
253.013
+40.336
18.97%
jan 1, 2013
232.847
-20.166
-7.97%
jan 1, 2014
238.166
+5.319
2.28%
jan 1, 2015
243.37
+5.204
2.18%
jan 1, 2016
211.711
-31.659
-13.01%
Ranking of countries by current statistics by years