29
/
en
AIzaSyAYiBZKx7MnpbEhh9jyipgxe19OcubqV5w
April 1, 2024
205383
Namibia
NAM
true
2
1
Import value index (2000 = 100)
2016,2015,2014,2013,2012,2011,2010,2009,2008,2007,2006,2005,2004,2003,2002,2001,2000,1999,1998,1997,1996,1995,1994,1993,1992,1991
Download
Global statistics library →Namibia →

Import value index (2000 = 100)

This statistics in other country:
AfghanistanAlbaniaAlgeriaAmerican SamoaAndorraAngolaAntigua and BarbudaArgentinaArmeniaArubaAustraliaAustriaAzerbaijanBahamas, TheBahrainBangladeshBarbadosBelarusBelgiumBelizeBeninBermudaBhutanBoliviaBosnia and HerzegovinaBotswanaBrazilBritish Virgin IslandsBrunei DarussalamBulgariaBurkina FasoBurundiCabo VerdeCambodiaCameroonCanadaCayman IslandsCentral African RepublicChadChileChinaColombiaComorosCongo, Dem. Rep.Congo, Rep.Costa RicaCote d'IvoireCroatiaCubaCuracaoCyprusCzech RepublicDenmarkDjiboutiDominicaDominican RepublicEcuadorEgypt, Arab Rep.El SalvadorEquatorial GuineaEritreaEstoniaEthiopiaFaroe IslandsFijiFinlandFranceFrench PolynesiaGabonGambia, TheGeorgiaGermanyGhanaGibraltarGreeceGreenlandGrenadaGuamGuatemalaGuineaGuinea-BissauGuyanaHaitiHondurasHong Kong SAR, ChinaHungaryIcelandIndiaIndonesiaIran, Islamic Rep.IraqIrelandIsraelItalyJamaicaJapanJordanKazakhstanKenyaKiribatiKorea, Dem. People’s Rep.Korea, Rep.KuwaitKyrgyz RepublicLao PDRLatviaLebanonLesothoLiberiaLibyaLithuaniaLuxembourgMacao SAR, ChinaMacedonia, FYRMadagascarMalawiMalaysiaMaldivesMaliMaltaMarshall IslandsMauritaniaMauritiusMexicoMicronesia, Fed. Sts.MoldovaMongoliaMoroccoMozambiqueMyanmarNamibiaNauruNepalNetherlandsNew CaledoniaNew ZealandNicaraguaNigerNigeriaNorthern Mariana IslandsNorwayOmanPakistanPalauPanamaPapua New GuineaParaguayPeruPhilippinesPolandPortugalQatarRomaniaRussian FederationRwandaSamoaSao Tome and PrincipeSaudi ArabiaSenegalSerbiaSeychellesSierra LeoneSingaporeSlovak RepublicSloveniaSolomon IslandsSomaliaSouth AfricaSpainSri LankaSt. Kitts and NevisSt. LuciaSt. Vincent and the GrenadinesSudanSurinameSwazilandSwedenSwitzerlandSyrian Arab RepublicTajikistanTanzaniaThailandTogoTongaTrinidad and TobagoTunisiaTurkeyTurkmenistanTurks and Caicos IslandsUgandaUkraineUnited Arab EmiratesUnited KingdomUnited StatesUruguayUzbekistanVanuatuVenezuela, RBVietnamWest Bank and GazaYemen, Rep.ZambiaZimbabwe
Timeline:
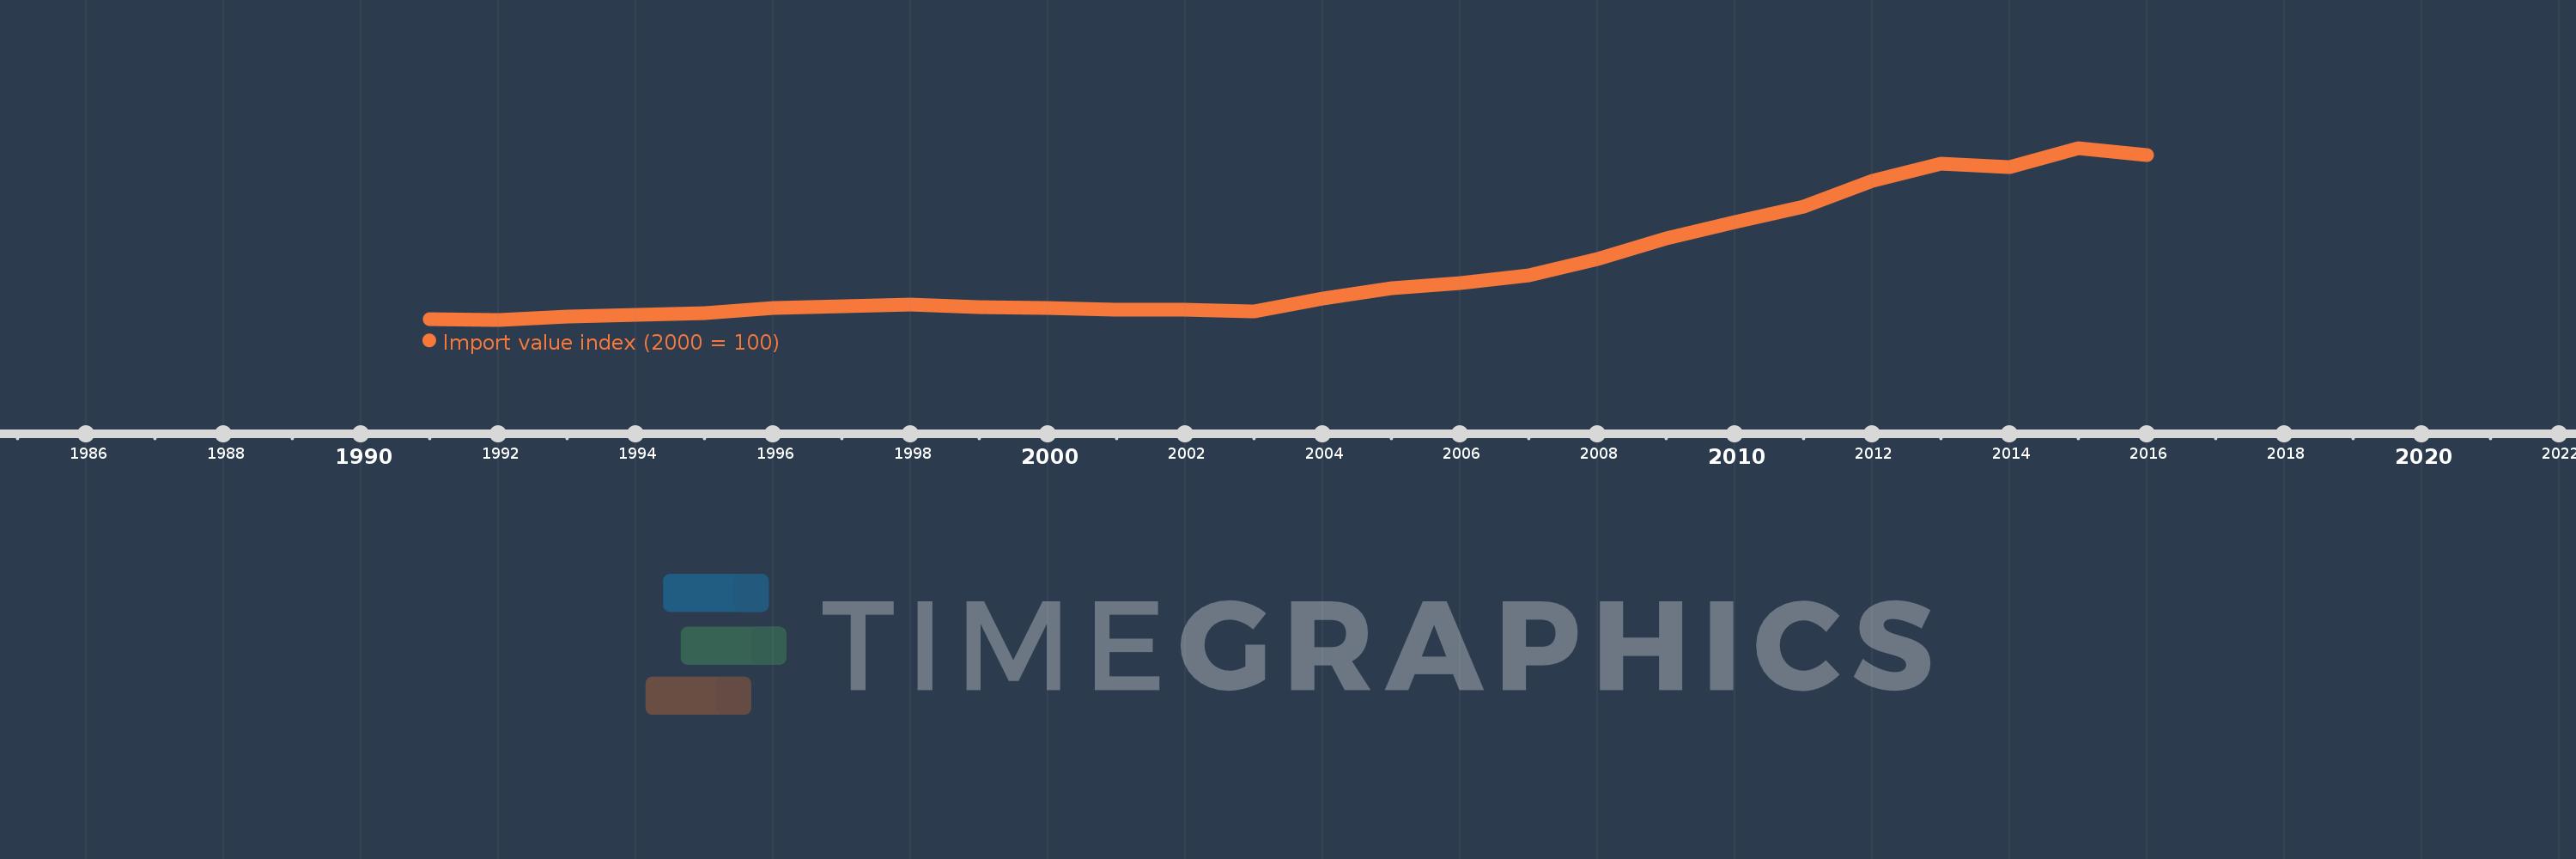
This timeline shows a graph from 1991 to 2016 of Namibia. No data until 1990. Number of actual observations by date: 26.
Source name:
World Development Indicators
Source organization:
United Nations Conference on Trade and Development, Handbook of Statistics and data files, and International Monetary Fund, International Financial Statistics.
Categories, topics:
Private Sector, Trade
Last updated:
apr 23, 2017
Indicators value changes by year
Mean:
208.283
Minimum:
74.124
jan 1, 1992
Maximum:
508.674
jan 1, 2015
At the date of observation
Value
Absolute change
Change from previous value
jan 1, 1991
75.068
+75.068
0.0%
jan 1, 1992
74.124
-0.945
-1.26%
jan 1, 1993
82.784
+8.661
11.68%
jan 1, 1994
85.542
+2.758
3.33%
jan 1, 1995
91.135
+5.593
6.54%
jan 1, 1996
104.25
+13.116
14.39%
jan 1, 1997
107.791
+3.541
3.4%
jan 1, 1998
113.105
+5.314
4.93%
jan 1, 1999
106.356
-6.749
-5.97%
jan 1, 2000
103.864
-2.492
-2.34%
jan 1, 2001
100.0
-3.864
-3.72%
jan 1, 2002
99.823
-0.177
-0.18%
jan 1, 2003
94.854
-4.969
-4.98%
jan 1, 2004
127.763
+32.909
34.69%
jan 1, 2005
154.581
+26.819
20.99%
jan 1, 2006
166.315
+11.734
7.59%
jan 1, 2007
186.103
+19.787
11.9%
jan 1, 2008
227.133
+41.031
22.05%
jan 1, 2009
280.045
+52.912
23.3%
jan 1, 2010
321.342
+41.297
14.75%
jan 1, 2011
359.413
+38.071
11.85%
jan 1, 2012
425.401
+65.988
18.36%
jan 1, 2013
468.203
+42.803
10.06%
jan 1, 2014
460.903
-7.3
-1.56%
jan 1, 2015
508.674
+47.771
10.36%
jan 1, 2016
490.774
-17.9
-3.52%
Ranking of countries by current statistics by years

Comments:

Send
PremiumAbout & FeedbackTermsPrivacy
logo
© 2022 Selected Technologies LLC – Morgan Hill, California