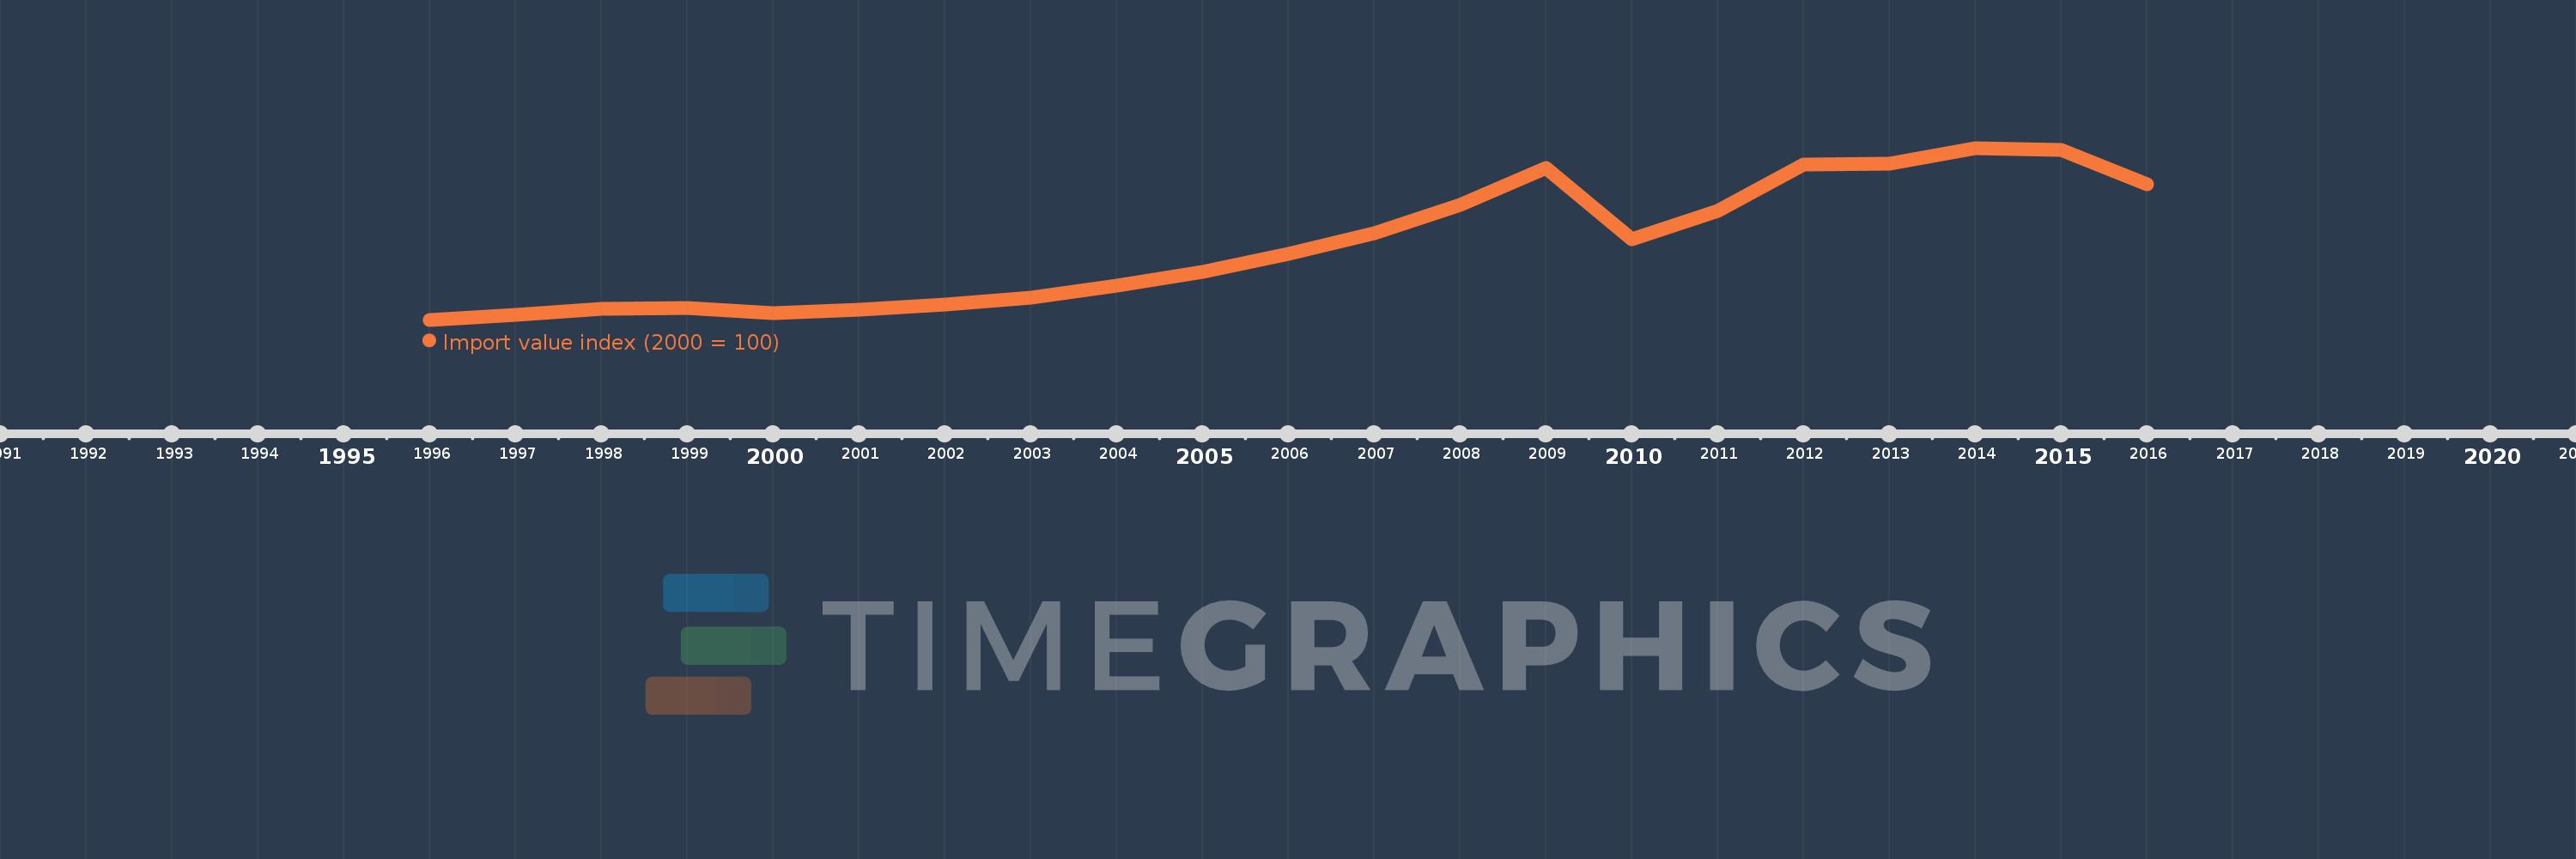
This timeline shows a graph from 1996 to 2016 of Lithuania. No data until 1995. Number of actual observations by date: 21.
Source name:
World Development Indicators
Source organization:
United Nations Conference on Trade and Development, Handbook of Statistics and data files, and International Monetary Fund, International Financial Statistics.
Categories, topics:
Private Sector, Trade
Last updated:
apr 23, 2017
Indicators value changes by year
Meaning:
313.81
Minimum:
66.899
jan 1, 1996
Maximum:
637.95
jan 1, 2014
At the date of observation
Value
Absolute change
Change from the previous value
jan 1, 1996
66.899
+66.899
0.0%
jan 1, 1997
83.579
+16.679
24.93%
jan 1, 1998
103.465
+19.887
23.79%
jan 1, 1999
106.214
+2.749
2.66%
jan 1, 2000
88.61
-17.605
-16.57%
jan 1, 2001
100.0
+11.39
12.85%
jan 1, 2002
116.442
+16.442
16.44%
jan 1, 2003
141.295
+24.854
21.34%
jan 1, 2004
179.676
+38.38
27.16%
jan 1, 2005
227.037
+47.361
26.36%
jan 1, 2006
284.98
+57.943
25.52%
jan 1, 2007
355.083
+70.103
24.6%
jan 1, 2008
447.443
+92.36
26.01%
jan 1, 2009
569.997
+122.554
27.39%
jan 1, 2010
335.486
-234.511
-41.14%
jan 1, 2011
428.941
+93.455
27.86%
jan 1, 2012
582.36
+153.419
35.77%
jan 1, 2013
585.869
+3.509
0.6%
jan 1, 2014
637.95
+52.081
8.89%
jan 1, 2015
630.396
-7.553
-1.18%
jan 1, 2016
518.294
-112.102
-17.78%
Ranking of countries by current statistics by years