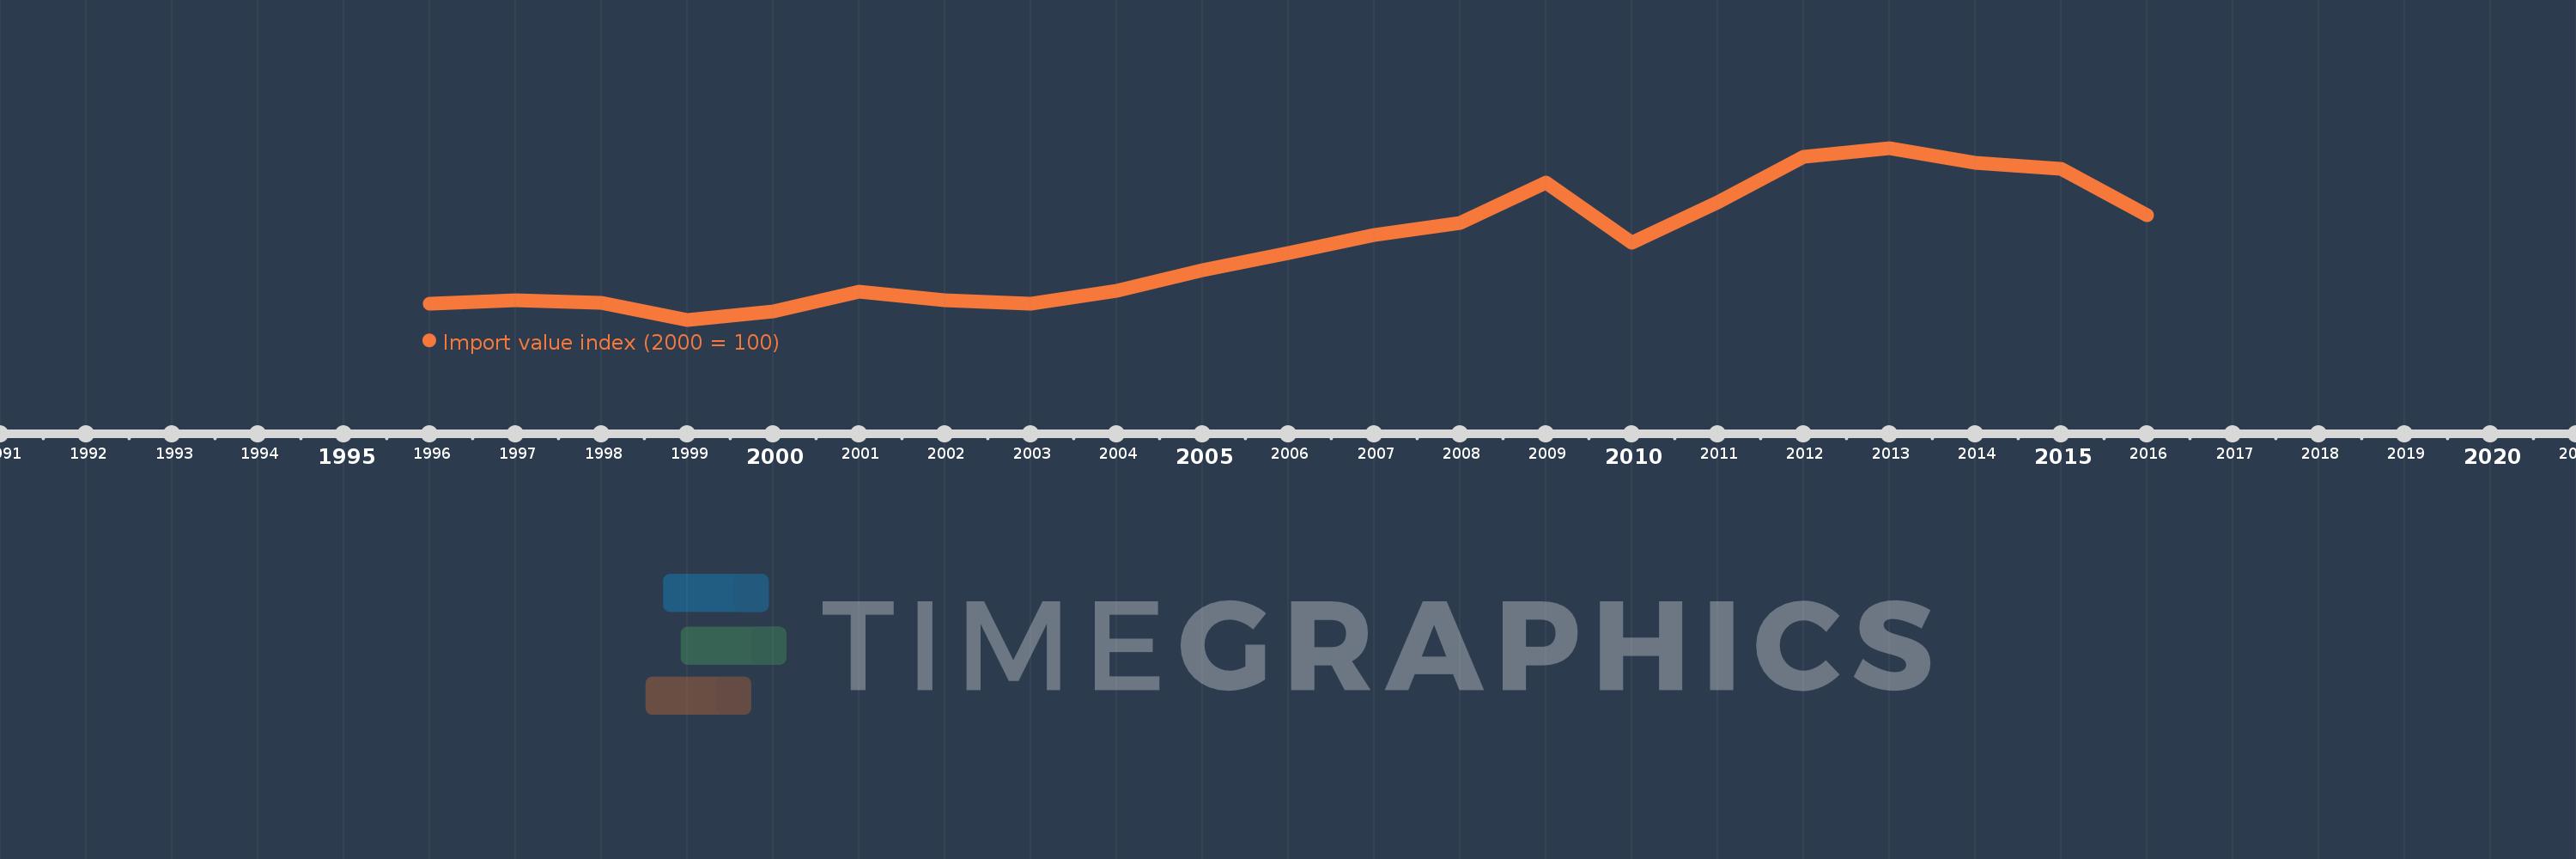
This timeline shows a graph from 1996 to 2016 of Japan. No data until 1995. Number of actual observations by date: 21.
Source name:
World Development Indicators
Source organization:
United Nations Conference on Trade and Development, Handbook of Statistics and data files, and International Monetary Fund, International Financial Statistics.
Categories, topics:
Private Sector, Trade
Last updated:
apr 23, 2017
Indicators value changes by year
Meaning:
141.515
Minimum:
73.907
jan 1, 1999
Maximum:
233.418
jan 1, 2013
At the date of observation
Value
Absolute change
Change from the previous value
jan 1, 1996
88.505
+88.505
0.0%
jan 1, 1997
92.001
+3.496
3.95%
jan 1, 1998
89.261
-2.74
-2.98%
jan 1, 1999
73.907
-15.354
-17.2%
jan 1, 2000
81.683
+7.776
10.52%
jan 1, 2001
100.0
+18.317
22.42%
jan 1, 2002
91.984
-8.016
-8.02%
jan 1, 2003
88.85
-3.134
-3.41%
jan 1, 2004
100.901
+12.051
13.56%
jan 1, 2005
119.771
+18.87
18.7%
jan 1, 2006
135.93
+16.159
13.49%
jan 1, 2007
152.582
+16.652
12.25%
jan 1, 2008
163.96
+11.378
7.46%
jan 1, 2009
200.926
+36.966
22.55%
jan 1, 2010
145.446
-55.48
-27.61%
jan 1, 2011
182.883
+37.437
25.74%
jan 1, 2012
225.391
+42.508
23.24%
jan 1, 2013
233.418
+8.027
3.56%
jan 1, 2014
219.537
-13.88
-5.95%
jan 1, 2015
214.009
-5.529
-2.52%
jan 1, 2016
170.877
-43.132
-20.15%
Ranking of countries by current statistics by years