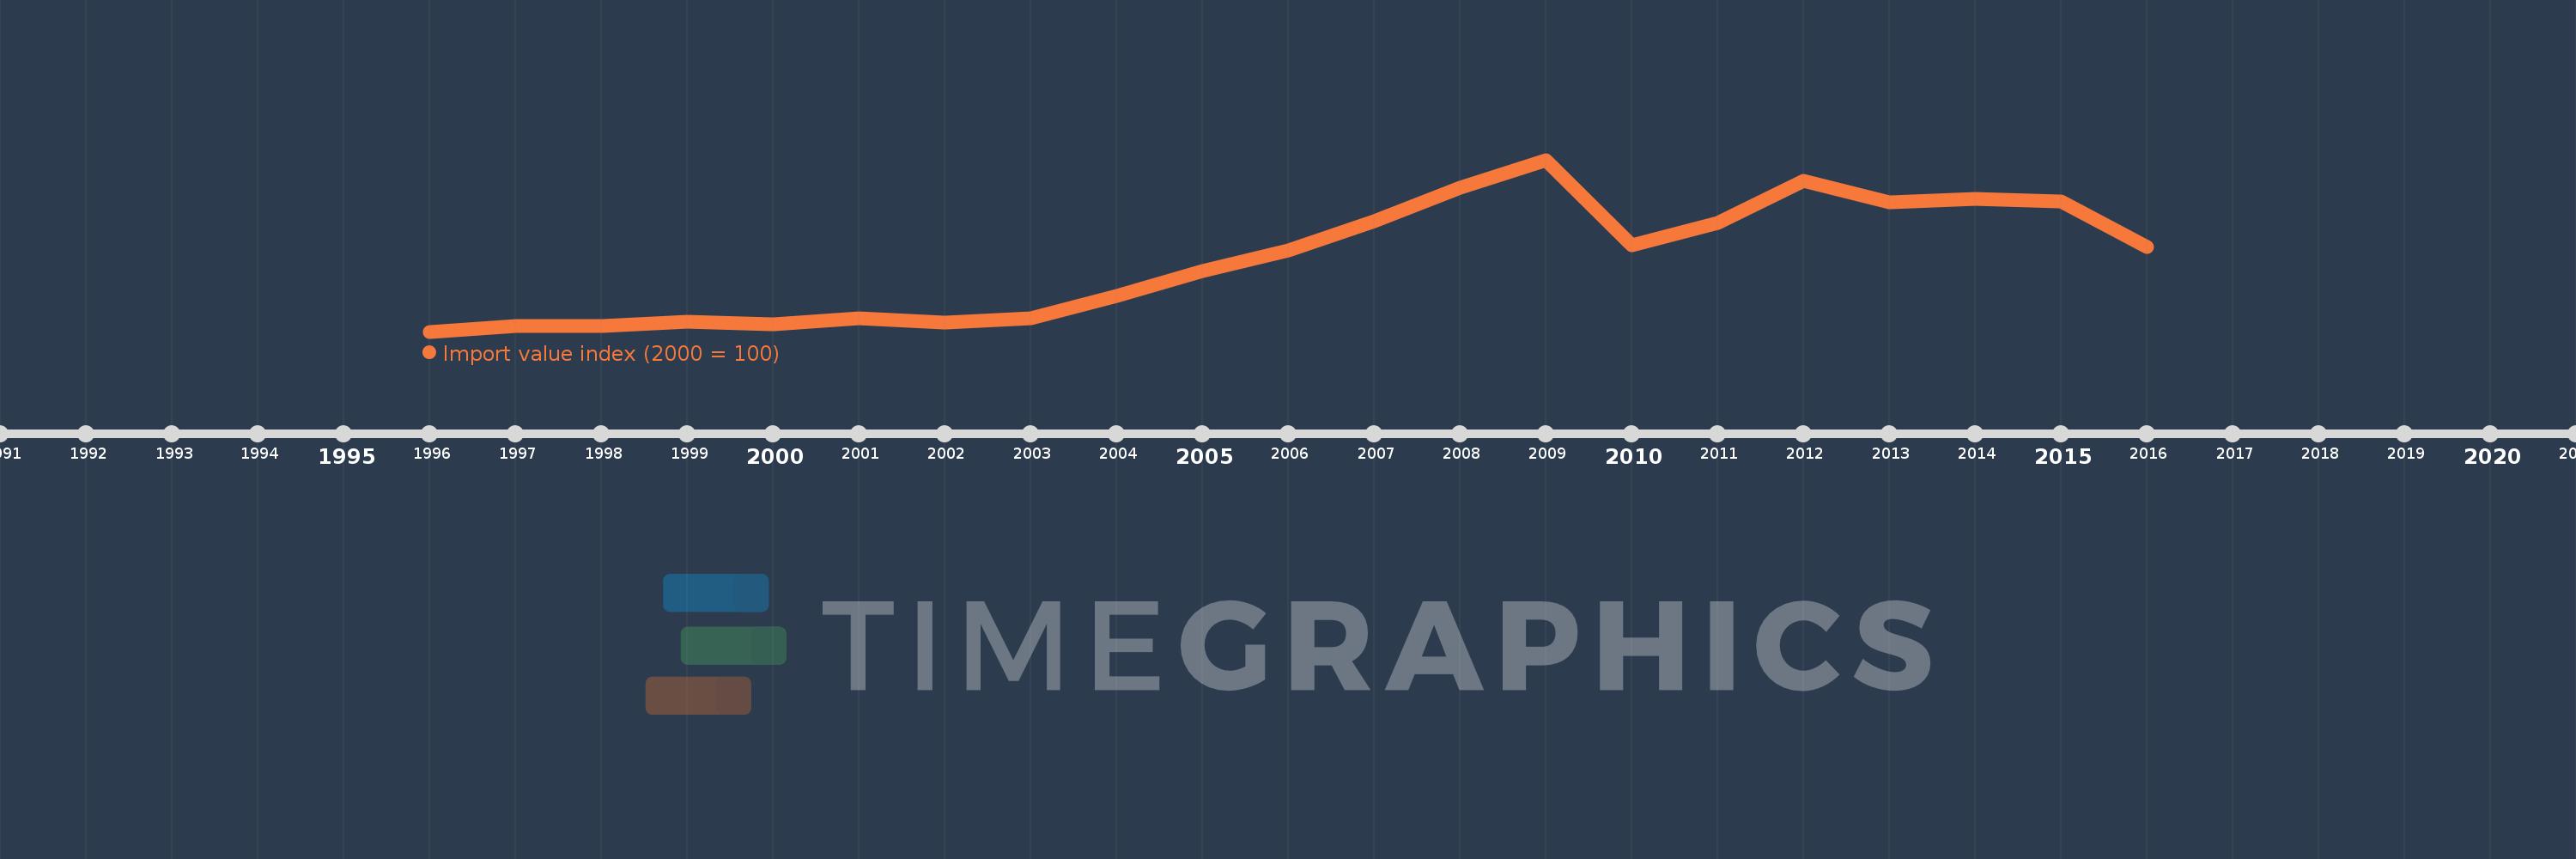
This timeline shows a graph from 1996 to 2016 of Finland. No data until 1995. Number of actual observations by date: 21.
Source name:
World Development Indicators
Source organization:
United Nations Conference on Trade and Development, Handbook of Statistics and data files, and International Monetary Fund, International Financial Statistics.
Categories, topics:
Private Sector, Trade
Last updated:
apr 23, 2017
Indicators value changes by year
Meaning:
160.657
Minimum:
85.778
jan 1, 1996
Maximum:
267.134
jan 1, 2009
At the date of observation
Value
Absolute change
Change from the previous value
jan 1, 1996
85.778
+85.778
0.0%
jan 1, 1997
91.342
+5.564
6.49%
jan 1, 1998
91.995
+0.653
0.71%
jan 1, 1999
95.838
+3.844
4.18%
jan 1, 2000
93.557
-2.281
-2.38%
jan 1, 2001
100.0
+6.443
6.89%
jan 1, 2002
94.997
-5.003
-5.0%
jan 1, 2003
99.593
+4.596
4.84%
jan 1, 2004
123.737
+24.144
24.24%
jan 1, 2005
149.727
+25.99
21.0%
jan 1, 2006
171.04
+21.314
14.23%
jan 1, 2007
201.92
+30.879
18.05%
jan 1, 2008
237.802
+35.883
17.77%
jan 1, 2009
267.134
+29.331
12.33%
jan 1, 2010
177.221
-89.912
-33.66%
jan 1, 2011
200.254
+23.033
13.0%
jan 1, 2012
245.255
+45.001
22.47%
jan 1, 2013
222.563
-22.692
-9.25%
jan 1, 2014
225.771
+3.208
1.44%
jan 1, 2015
223.374
-2.396
-1.06%
jan 1, 2016
174.893
-48.482
-21.7%
Ranking of countries by current statistics by years