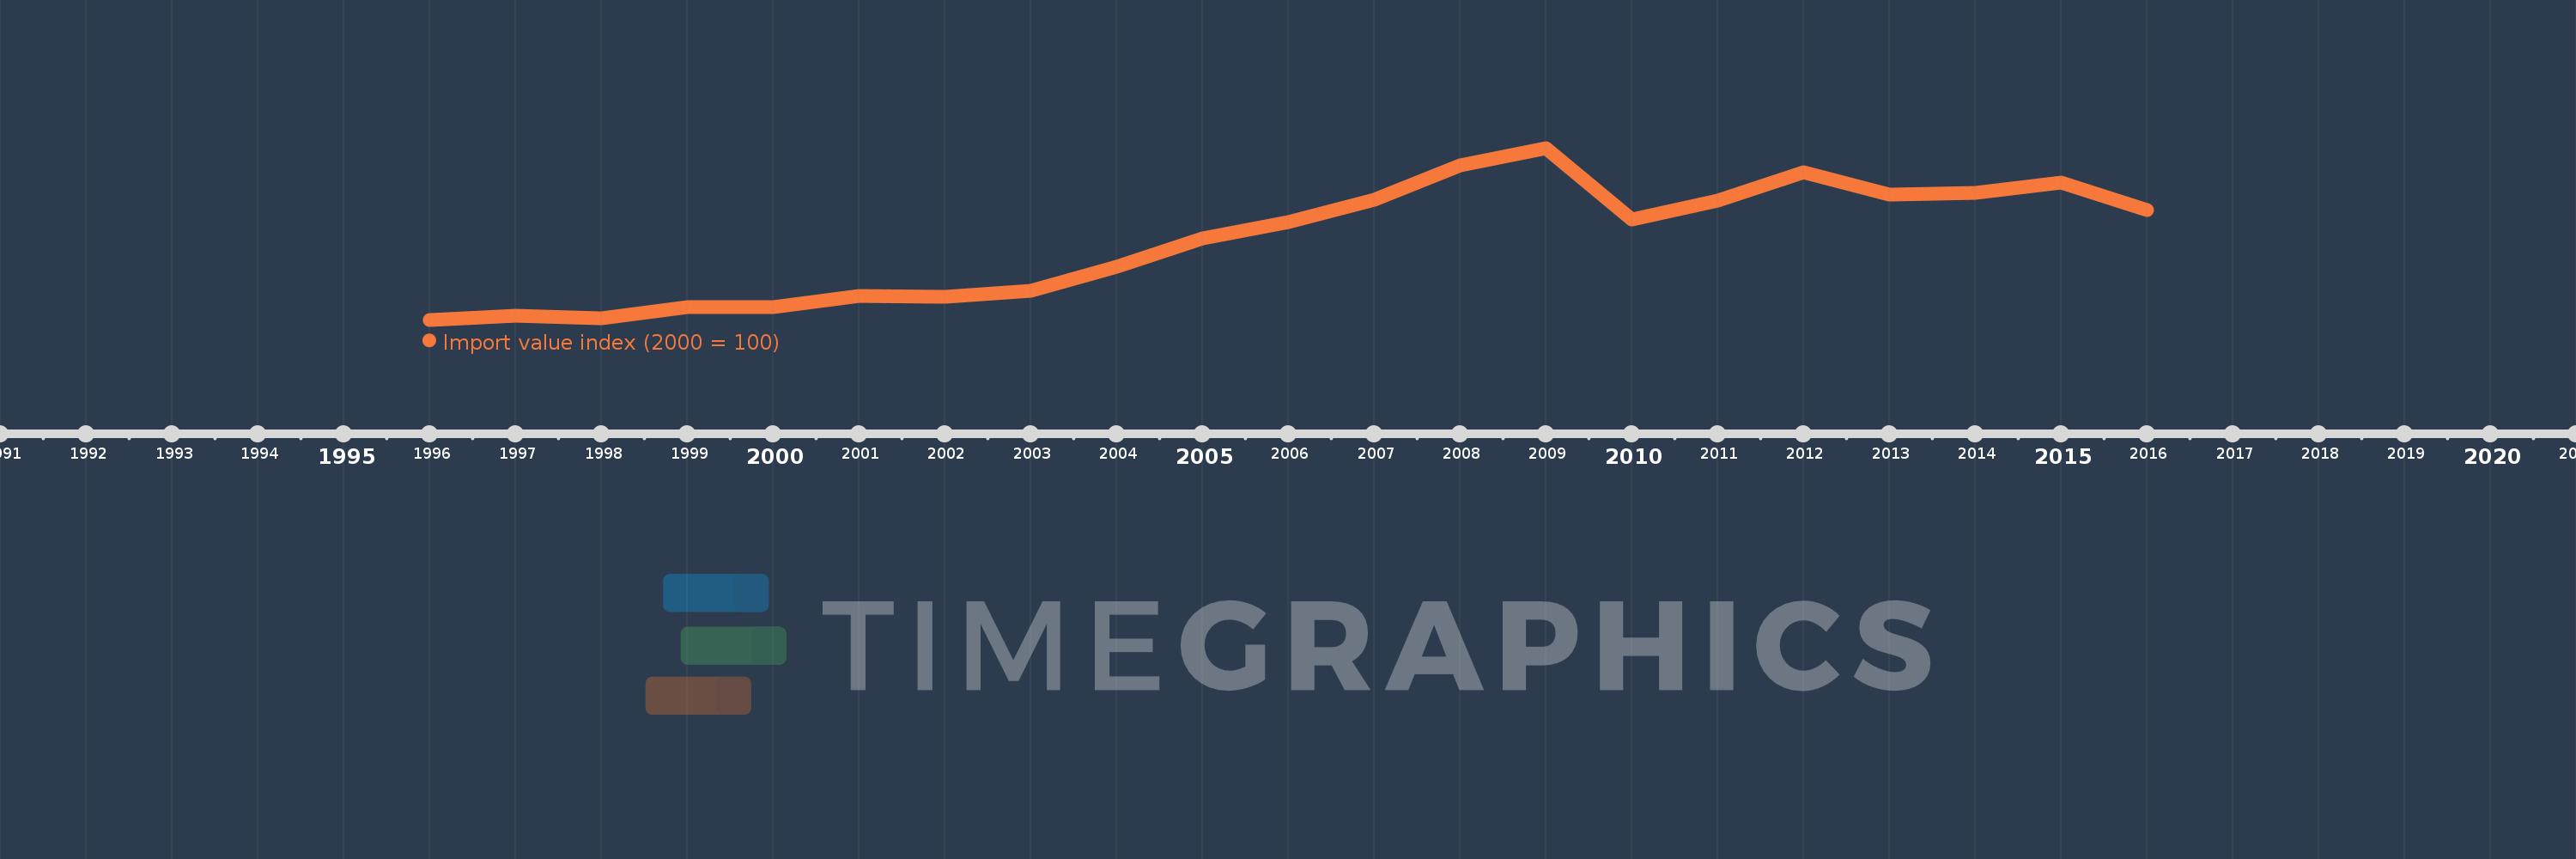
This timeline shows a graph from 1996 to 2016 of Spain. No data until 1995. Number of actual observations by date: 21.
Source name:
World Development Indicators
Source organization:
United Nations Conference on Trade and Development, Handbook of Statistics and data files, and International Monetary Fund, International Financial Statistics.
Categories, topics:
Private Sector, Trade
Last updated:
apr 23, 2017
Indicators value changes by year
Meaning:
163.114
Minimum:
72.898
jan 1, 1996
Maximum:
270.166
jan 1, 2009
At the date of observation
Value
Absolute change
Change from the previous value
jan 1, 1996
72.898
+72.898
0.0%
jan 1, 1997
77.721
+4.823
6.62%
jan 1, 1998
74.268
-3.453
-4.44%
jan 1, 1999
87.654
+13.386
18.02%
jan 1, 2000
86.977
-0.677
-0.77%
jan 1, 2001
100.0
+13.023
14.97%
jan 1, 2002
99.289
-0.711
-0.71%
jan 1, 2003
106.002
+6.713
6.76%
jan 1, 2004
133.928
+27.927
26.35%
jan 1, 2005
165.855
+31.927
23.84%
jan 1, 2006
185.408
+19.553
11.79%
jan 1, 2007
211.031
+25.624
13.82%
jan 1, 2008
249.941
+38.91
18.44%
jan 1, 2009
270.166
+20.225
8.09%
jan 1, 2010
188.253
-81.913
-30.32%
jan 1, 2011
209.952
+21.699
11.53%
jan 1, 2012
241.791
+31.838
15.16%
jan 1, 2013
216.58
-25.211
-10.43%
jan 1, 2014
218.673
+2.093
0.97%
jan 1, 2015
230.439
+11.766
5.38%
jan 1, 2016
198.573
-31.865
-13.83%
Ranking of countries by current statistics by years