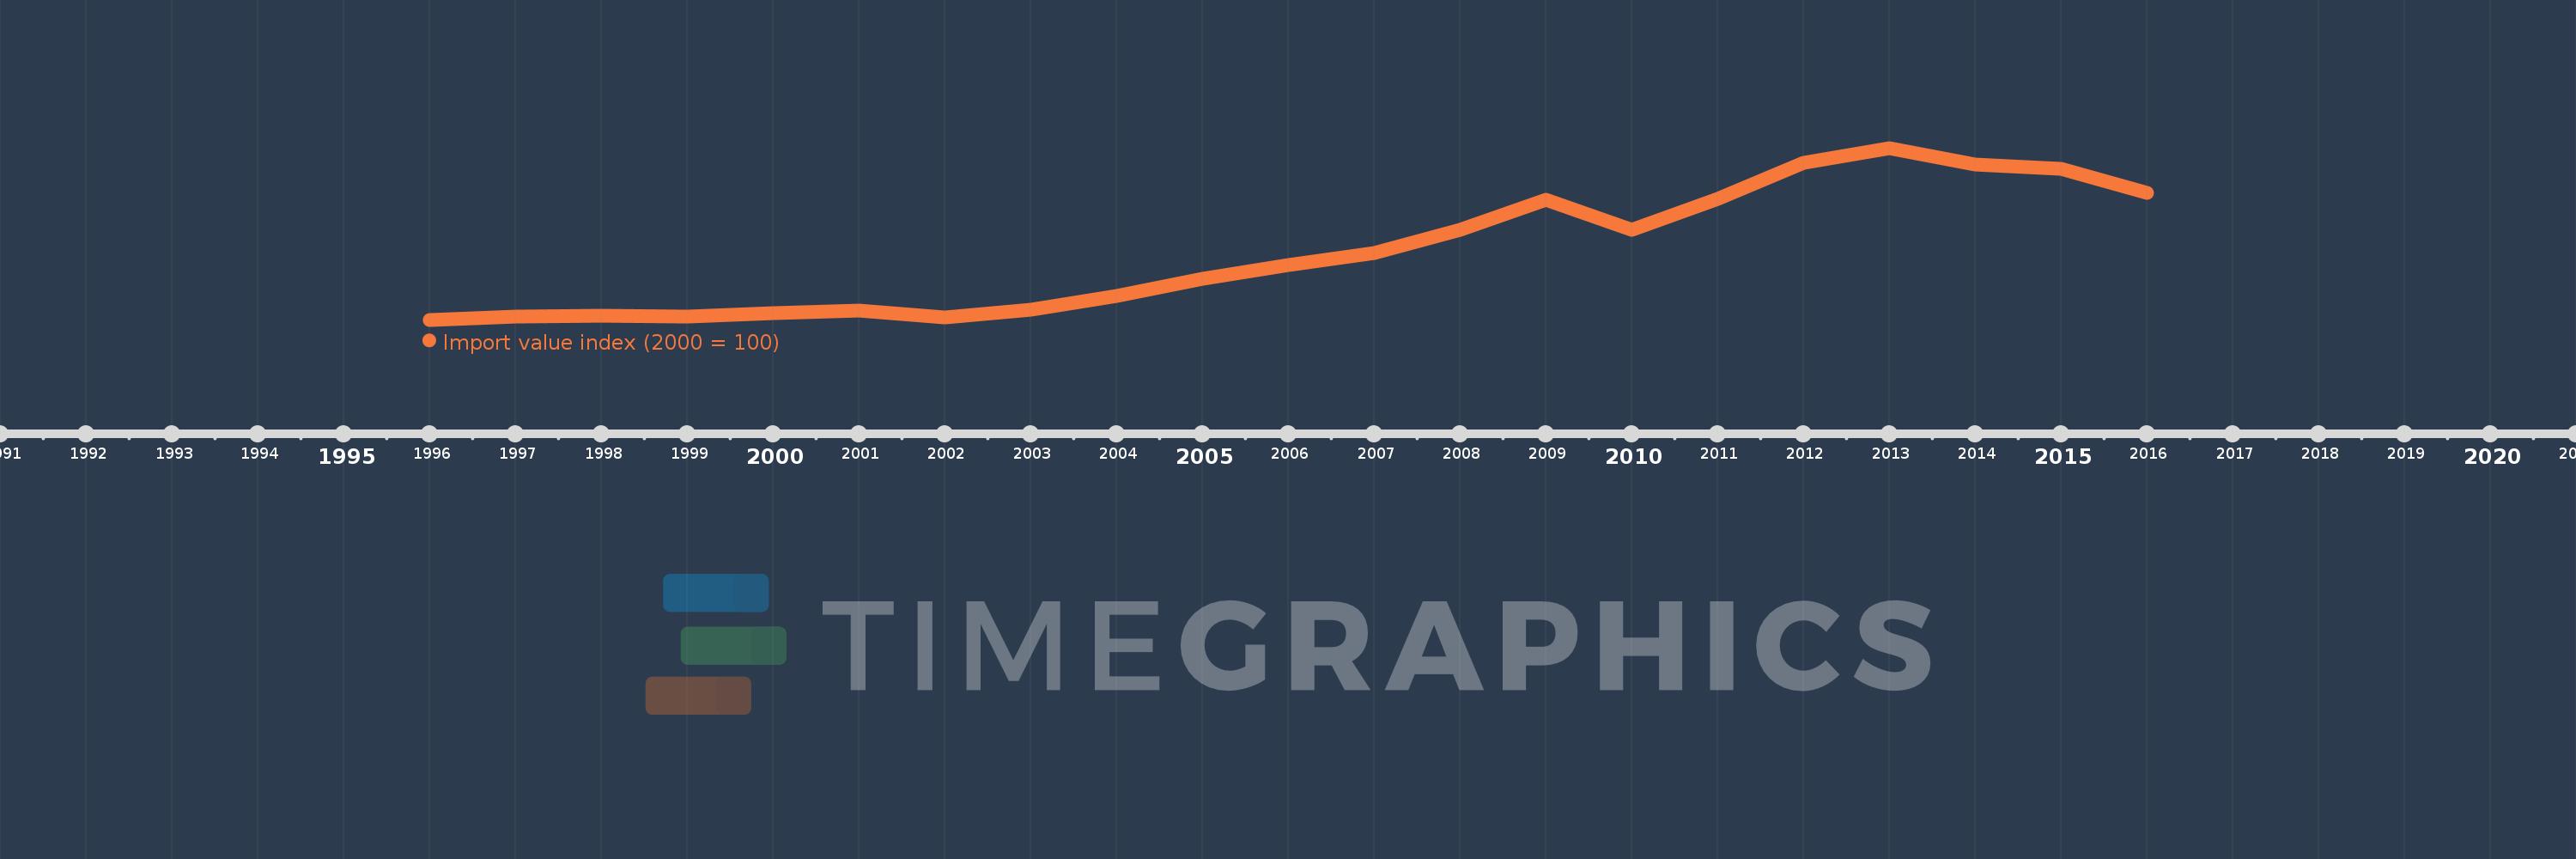
This timeline shows a graph from 1996 to 2016 of Australia. No data until 1995. Number of actual observations by date: 21.
Source name:
World Development Indicators
Source organization:
United Nations Conference on Trade and Development, Handbook of Statistics and data files, and International Monetary Fund, International Financial Statistics.
Categories, topics:
Private Sector, Trade
Last updated:
apr 23, 2017
Indicators value changes by year
Meaning:
194.551
Minimum:
85.676
jan 1, 1996
Maximum:
364.805
jan 1, 2013
At the date of observation
Value
Absolute change
Change from the previous value
jan 1, 1996
85.676
+85.676
0.0%
jan 1, 1997
91.47
+5.794
6.76%
jan 1, 1998
92.119
+0.65
0.71%
jan 1, 1999
90.355
-1.764
-1.92%
jan 1, 2000
96.685
+6.33
7.01%
jan 1, 2001
100.0
+3.315
3.43%
jan 1, 2002
89.318
-10.682
-10.68%
jan 1, 2003
101.623
+12.305
13.78%
jan 1, 2004
124.544
+22.921
22.55%
jan 1, 2005
152.923
+28.38
22.79%
jan 1, 2006
175.148
+22.225
14.53%
jan 1, 2007
194.681
+19.533
11.15%
jan 1, 2008
231.146
+36.465
18.73%
jan 1, 2009
279.99
+48.843
21.13%
jan 1, 2010
231.335
-48.655
-17.38%
jan 1, 2011
281.899
+50.564
21.86%
jan 1, 2012
340.704
+58.804
20.86%
jan 1, 2013
364.805
+24.101
7.07%
jan 1, 2014
338.521
-26.283
-7.2%
jan 1, 2015
331.242
-7.28
-2.15%
jan 1, 2016
291.378
-39.864
-12.03%
Ranking of countries by current statistics by years