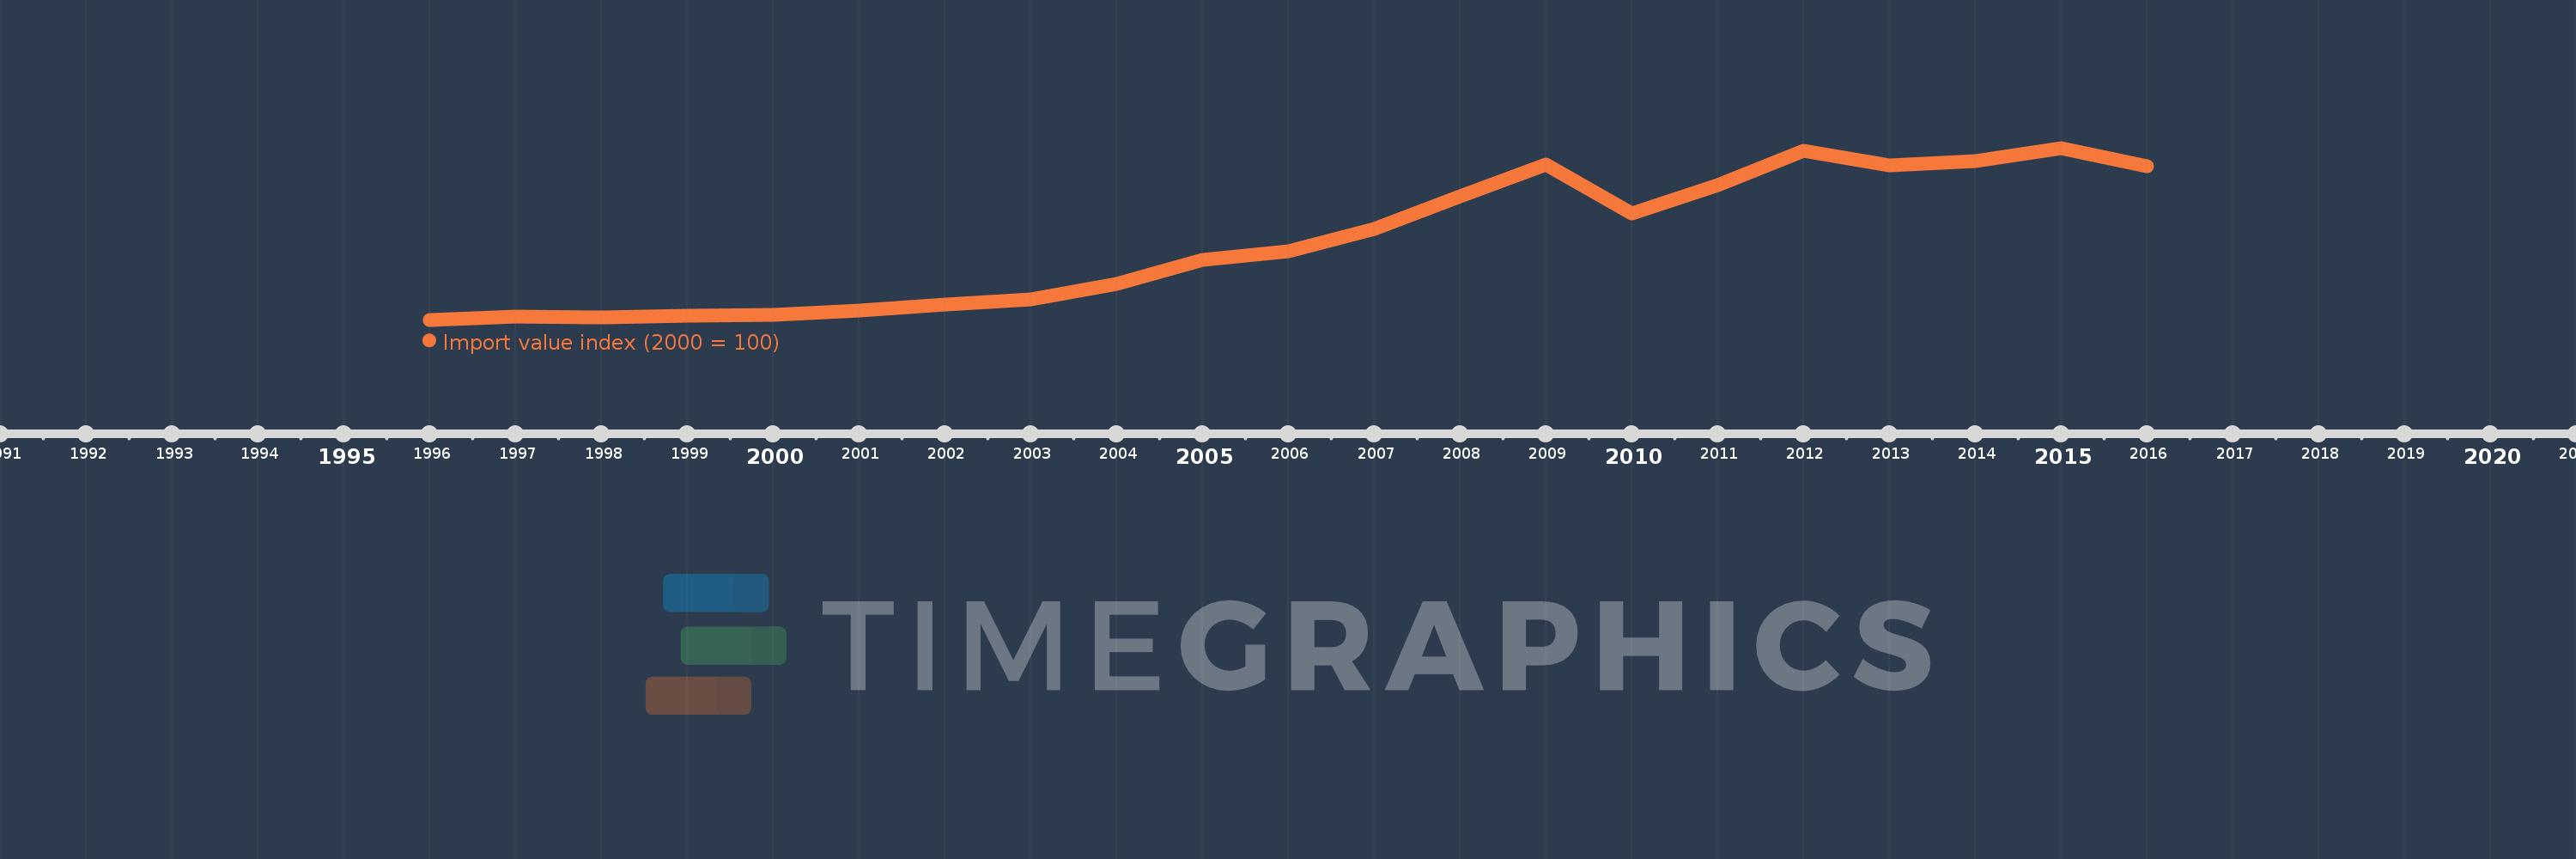
This timeline shows a graph from 1996 to 2016 of Czech Republic. No data until 1995. Number of actual observations by date: 21.
Source name:
World Development Indicators
Source organization:
United Nations Conference on Trade and Development, Handbook of Statistics and data files, and International Monetary Fund, International Financial Statistics.
Categories, topics:
Private Sector, Trade
Last updated:
apr 23, 2017
Indicators value changes by year
Meaning:
262.365
Minimum:
78.454
jan 1, 1996
Maximum:
482.81
jan 1, 2015
At the date of observation
Value
Absolute change
Change from the previous value
jan 1, 1996
78.454
+78.454
0.0%
jan 1, 1997
86.945
+8.491
10.82%
jan 1, 1998
84.771
-2.174
-2.5%
jan 1, 1999
88.634
+3.862
4.56%
jan 1, 2000
89.019
+0.386
0.44%
jan 1, 2001
100.0
+10.981
12.34%
jan 1, 2002
113.521
+13.521
13.52%
jan 1, 2003
127.153
+13.633
12.01%
jan 1, 2004
161.779
+34.626
27.23%
jan 1, 2005
218.824
+57.045
35.26%
jan 1, 2006
239.292
+20.468
9.35%
jan 1, 2007
291.455
+52.163
21.8%
jan 1, 2008
369.576
+78.121
26.8%
jan 1, 2009
444.226
+74.649
20.2%
jan 1, 2010
328.539
-115.687
-26.04%
jan 1, 2011
396.106
+67.567
20.57%
jan 1, 2012
475.773
+79.667
20.11%
jan 1, 2013
442.269
-33.505
-7.04%
jan 1, 2014
451.172
+8.904
2.01%
jan 1, 2015
482.81
+31.638
7.01%
jan 1, 2016
439.351
-43.46
-9.0%
Ranking of countries by current statistics by years