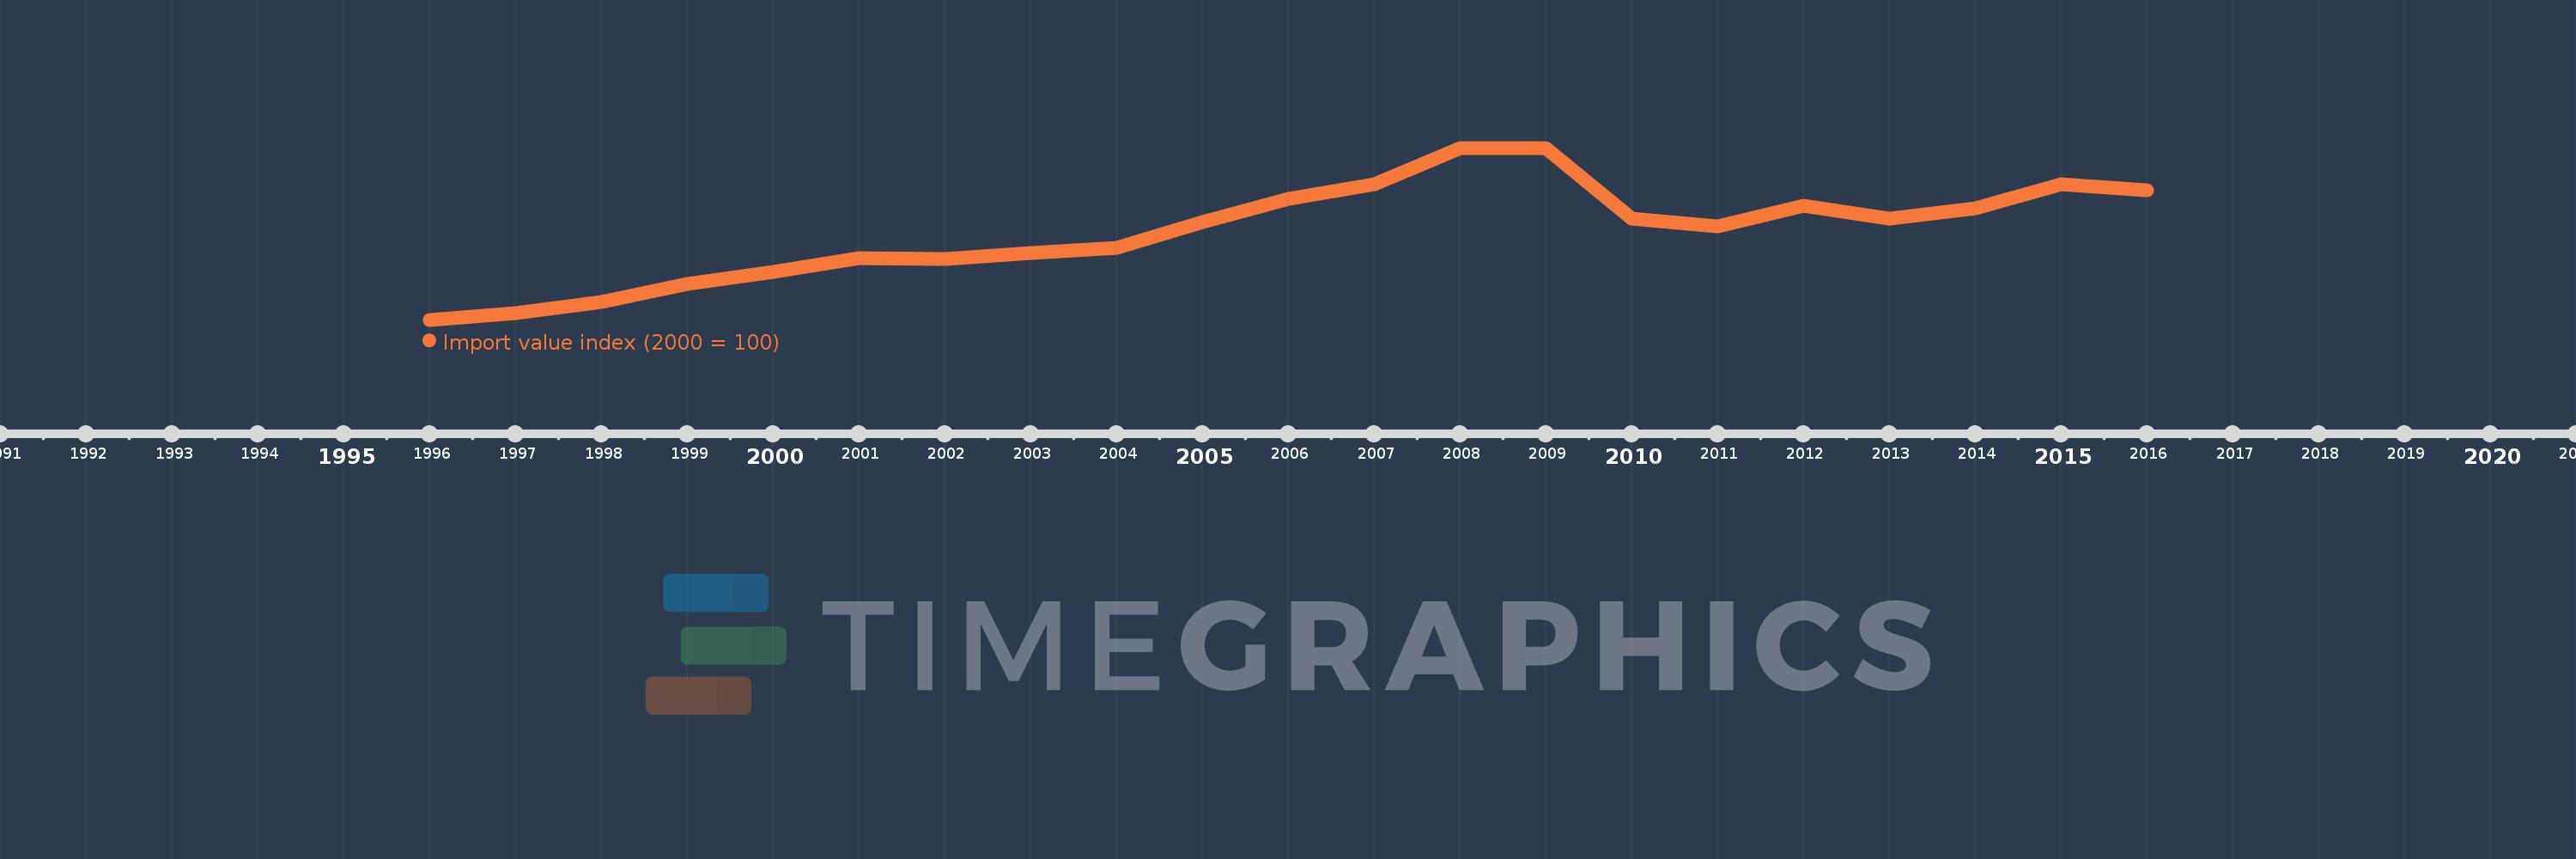
This timeline shows a graph from 1996 to 2016 of Ireland. No data until 1995. Number of actual observations by date: 21.
Source name:
World Development Indicators
Source organization:
United Nations Conference on Trade and Development, Handbook of Statistics and data files, and International Monetary Fund, International Financial Statistics.
Categories, topics:
Private Sector, Trade
Last updated:
apr 23, 2017
Indicators value changes by year
Meaning:
115.599
Minimum:
63.51
jan 1, 1996
Maximum:
164.911
jan 1, 2009
At the date of observation
Value
Absolute change
Change from the previous value
jan 1, 1996
63.51
+63.51
0.0%
jan 1, 1997
67.316
+3.806
5.99%
jan 1, 1998
74.151
+6.835
10.15%
jan 1, 1999
84.756
+10.605
14.3%
jan 1, 2000
91.943
+7.188
8.48%
jan 1, 2001
100.0
+8.057
8.76%
jan 1, 2002
99.295
-0.705
-0.7%
jan 1, 2003
102.914
+3.618
3.64%
jan 1, 2004
105.835
+2.921
2.84%
jan 1, 2005
121.406
+15.571
14.71%
jan 1, 2006
134.665
+13.259
10.92%
jan 1, 2007
143.607
+8.942
6.64%
jan 1, 2008
164.63
+21.024
14.64%
jan 1, 2009
164.911
+0.281
0.17%
jan 1, 2010
123.154
-41.758
-25.32%
jan 1, 2011
118.385
-4.768
-3.87%
jan 1, 2012
130.817
+12.432
10.5%
jan 1, 2013
123.282
-7.535
-5.76%
jan 1, 2014
129.338
+6.056
4.91%
jan 1, 2015
143.55
+14.212
10.99%
jan 1, 2016
140.107
-3.442
-2.4%
Ranking of countries by current statistics by years