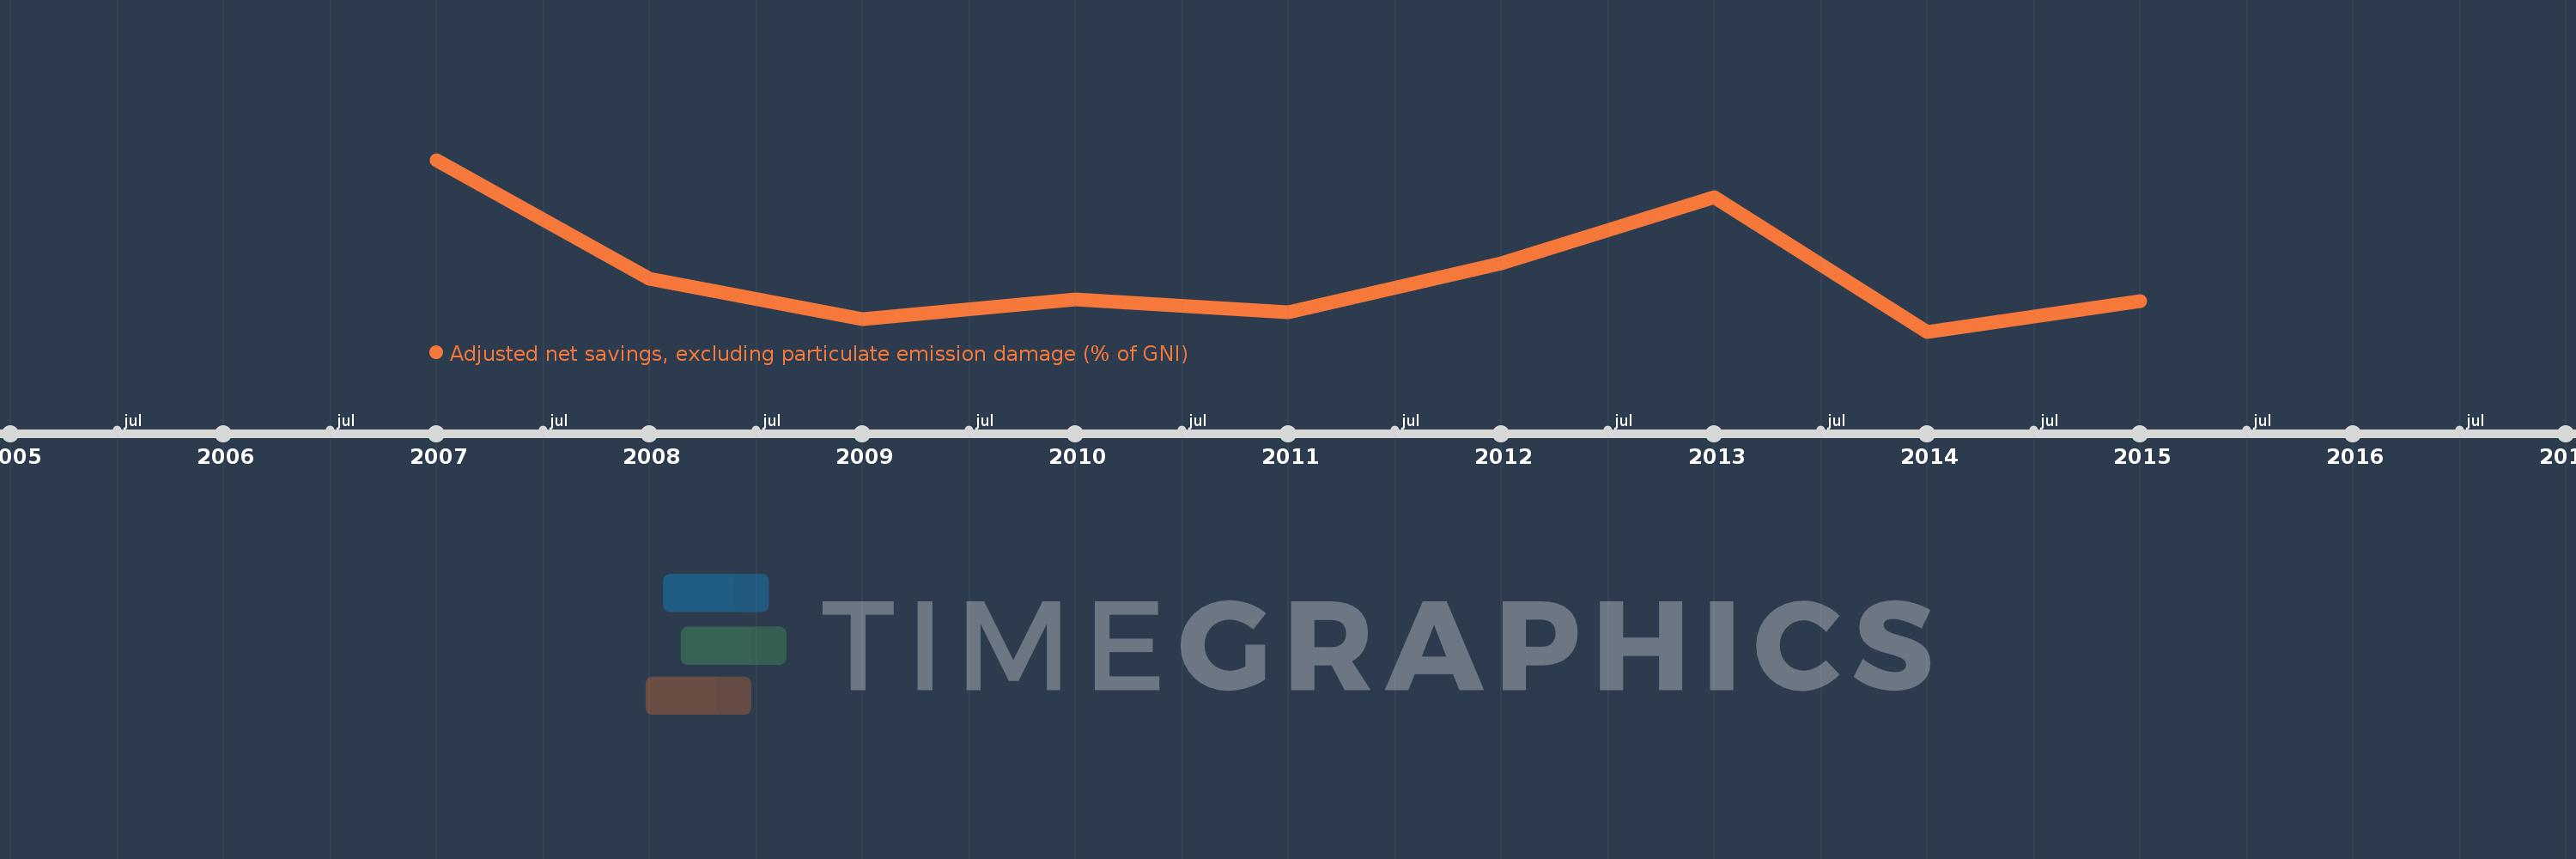
This timeline shows a graph from 2007 to 2015 of Bhutan. No data until 2006. Number of actual observations by date: 9.
Source name:
World Development Indicators
Source organization:
World Bank staff estimates based on sources and methods in World Bank's "The Changing Wealth of Nations: Measuring Sustainable Development in the New Millennium" (2011).
Categories, topics:
Economy & Growth, Environment
Last updated:
apr 23, 2017
Indicators value changes by year
Meaning:
20.278
Minimum:
10.498
jan 1, 2014
Maximum:
39.448
jan 1, 2007
At the date of observation
Value
Absolute change
Change from the previous value
jan 1, 2007
39.448
+39.448
0.0%
jan 1, 2008
19.383
-20.065
-50.86%
jan 1, 2009
12.659
-6.725
-34.69%
jan 1, 2010
15.941
+3.282
25.93%
jan 1, 2011
13.809
-2.132
-13.38%
jan 1, 2012
21.973
+8.165
59.13%
jan 1, 2013
33.159
+11.185
50.9%
jan 1, 2014
10.498
-22.661
-68.34%
jan 1, 2015
15.631
+5.134
48.9%
Ranking of countries by current statistics by years