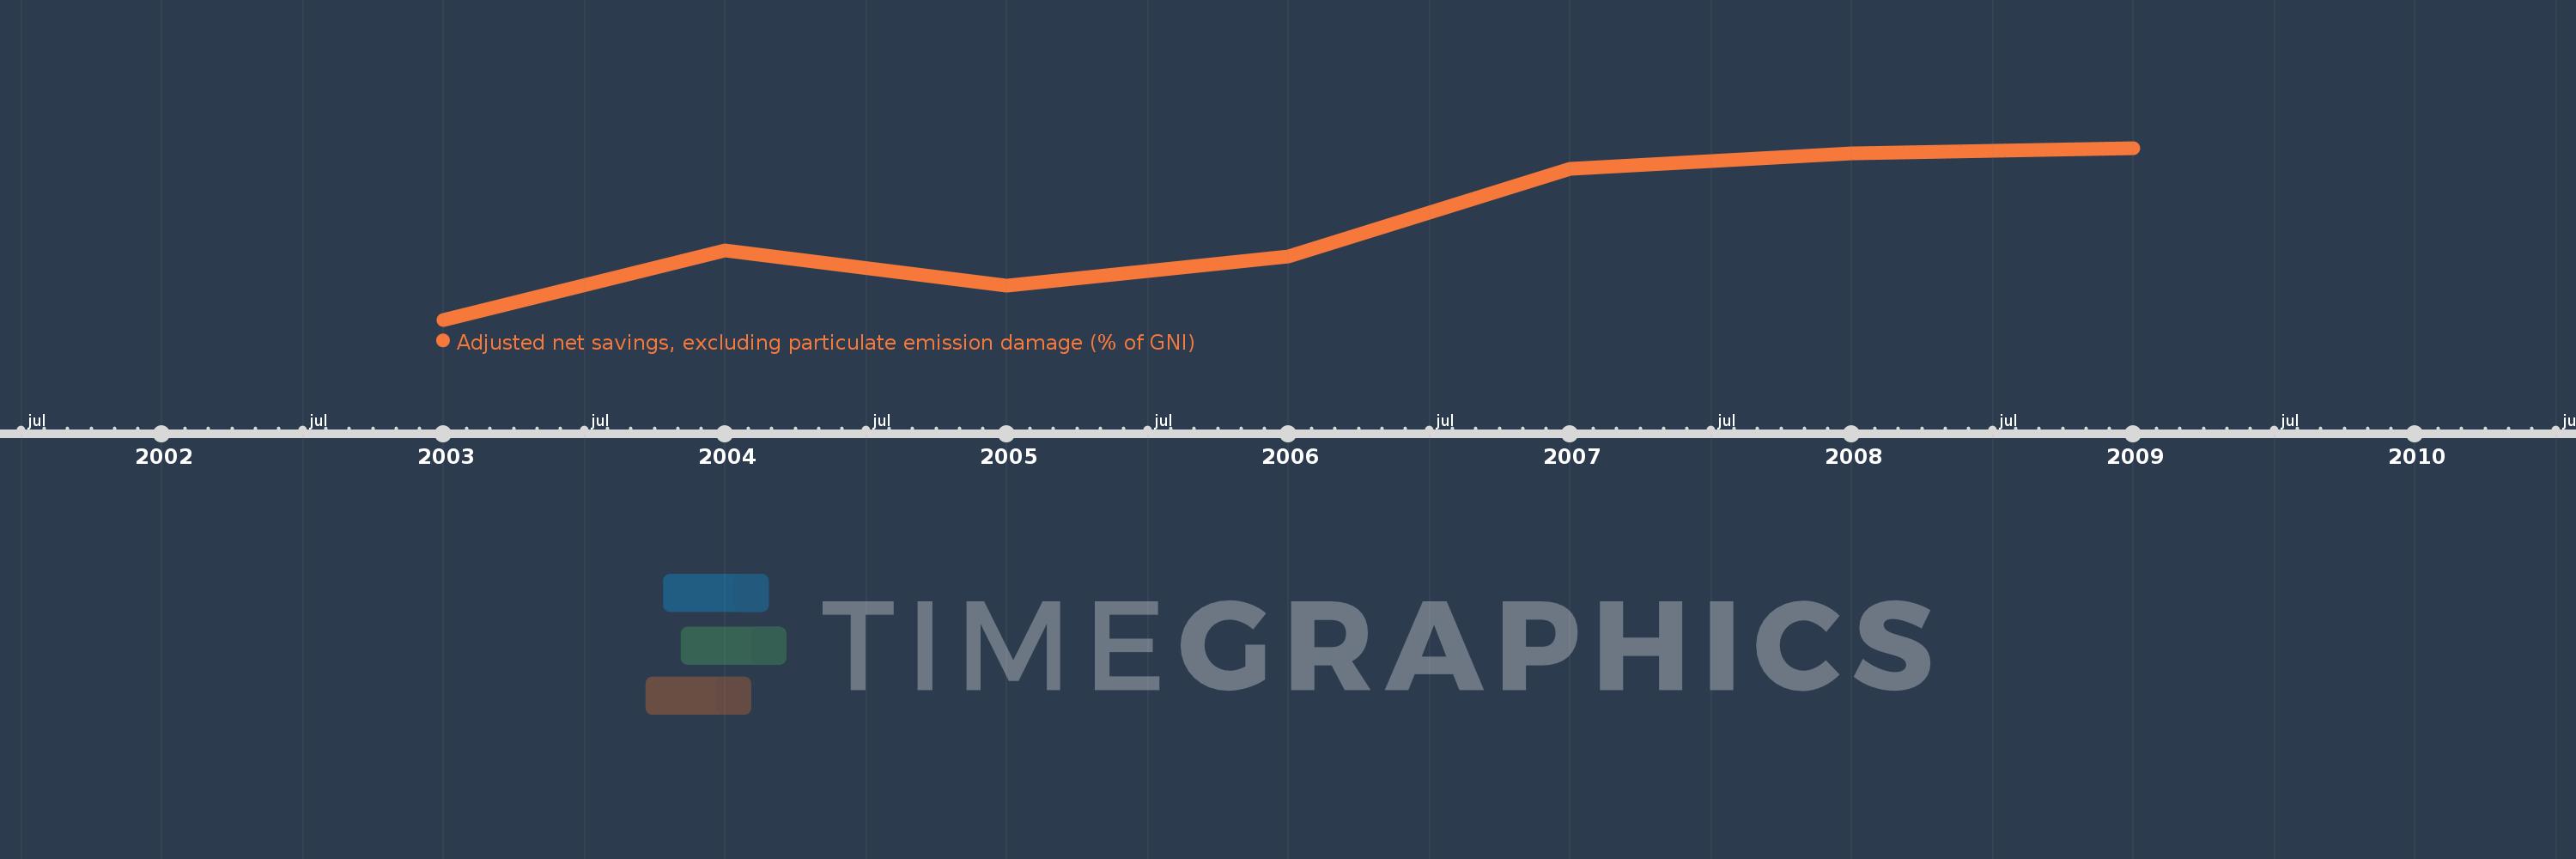
This timeline shows a graph from 2003 to 2009 of Libya. No data until 2002. Number of actual observations by date: 7.
Source name:
World Development Indicators
Source organization:
World Bank staff estimates based on sources and methods in World Bank's "The Changing Wealth of Nations: Measuring Sustainable Development in the New Millennium" (2011).
Categories, topics:
Economy & Growth, Environment
Last updated:
apr 23, 2017
Indicators value changes by year
Meaning:
14.514
Minimum:
-9.359
jan 1, 2003
Maximum:
34.37
jan 1, 2009
At the date of observation
Value
Absolute change
Change from the previous value
jan 1, 2003
-9.359
-9.359
0.0%
jan 1, 2004
8.182
+17.541
-187.42%
jan 1, 2005
-0.616
-8.797
-107.53%
jan 1, 2006
6.848
+7.464
-1.21K%
jan 1, 2007
29.084
+22.236
324.7%
jan 1, 2008
33.089
+4.004
13.77%
jan 1, 2009
34.37
+1.281
3.87%
Ranking of countries by current statistics by years