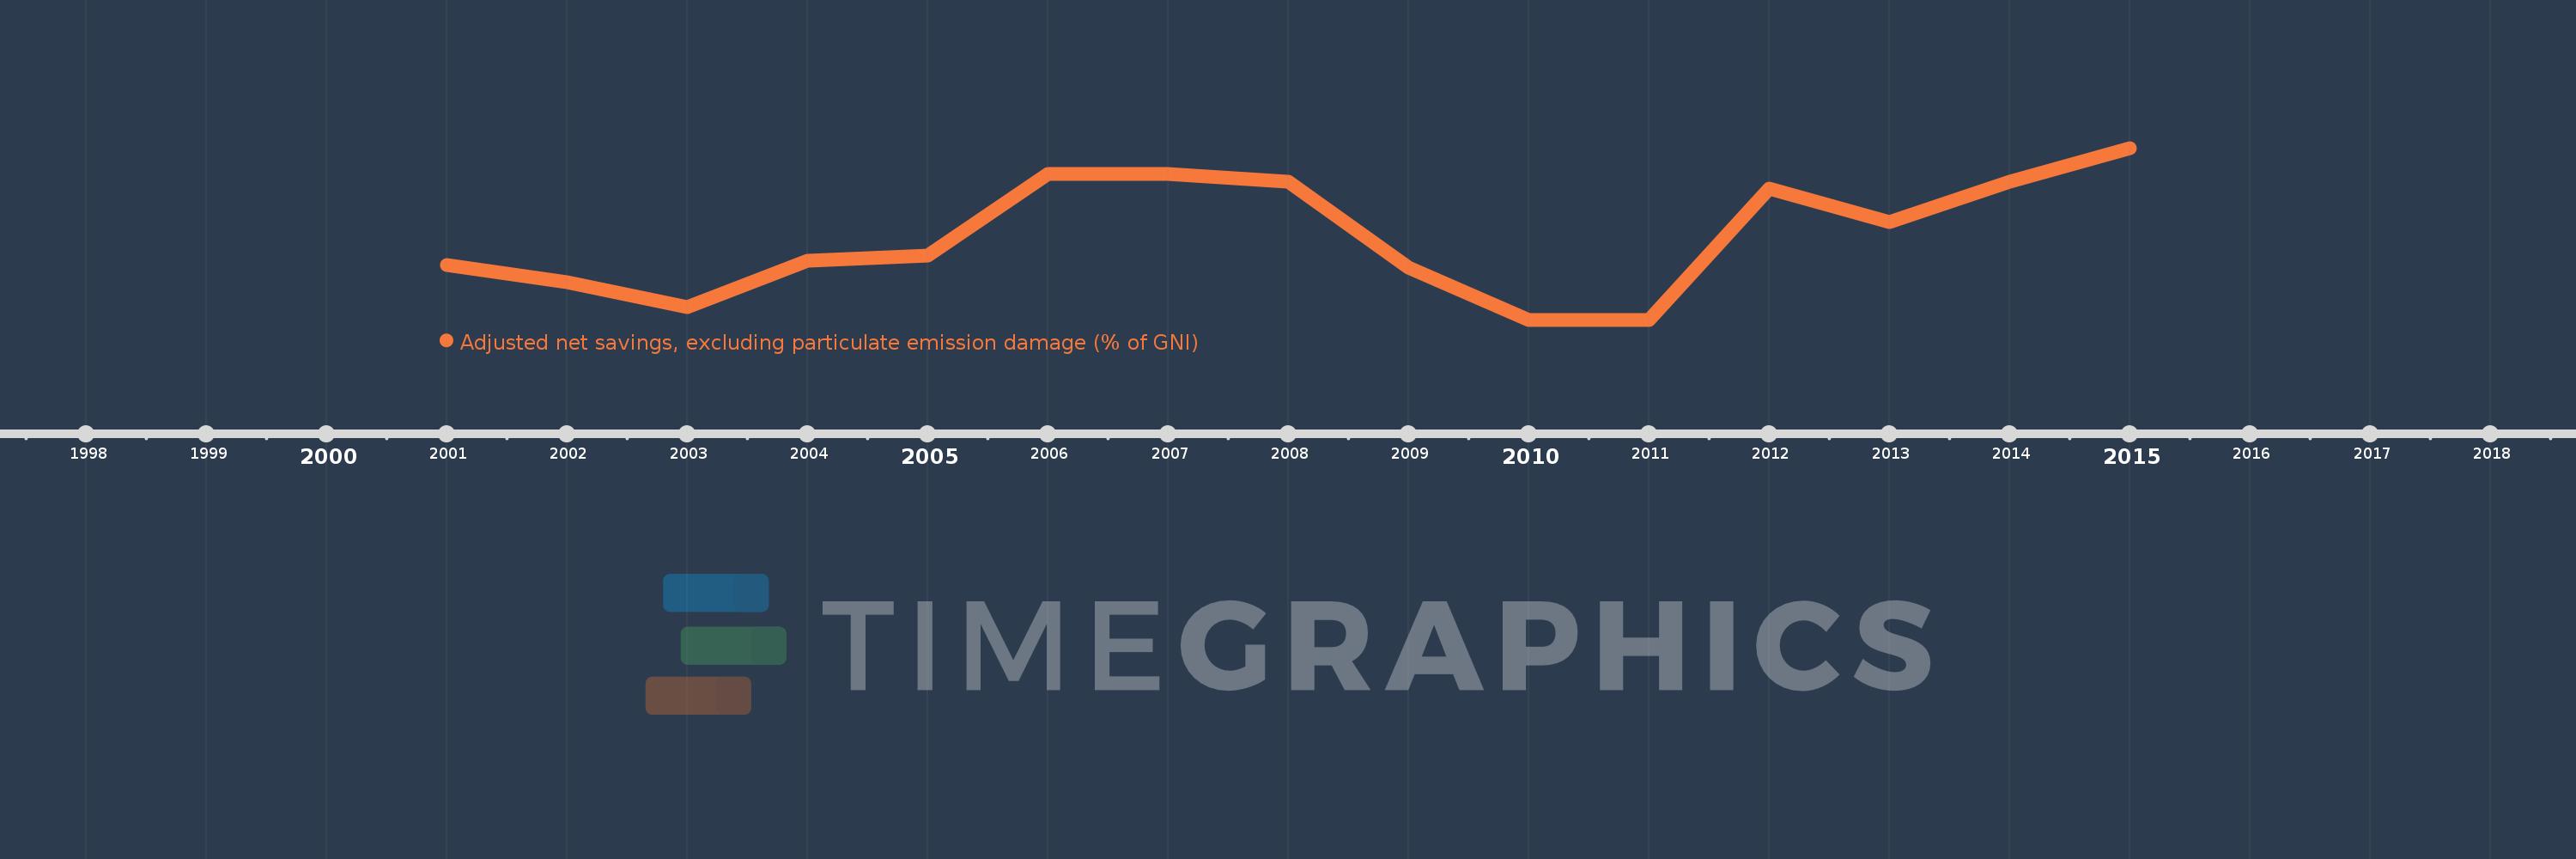
This timeline shows a graph from 2001 to 2015 of Estonia. No data until 2000. Number of actual observations by date: 15.
Source name:
World Development Indicators
Source organization:
World Bank staff estimates based on sources and methods in World Bank's "The Changing Wealth of Nations: Measuring Sustainable Development in the New Millennium" (2011).
Categories, topics:
Economy & Growth, Environment
Last updated:
apr 23, 2017
Indicators value changes by year
Meaning:
13.704
Minimum:
10.933
jan 1, 2011
Maximum:
16.653
jan 1, 2015
At the date of observation
Value
Absolute change
Change from the previous value
jan 1, 2001
12.753
+12.753
0.0%
jan 1, 2002
12.185
-0.568
-4.45%
jan 1, 2003
11.345
-0.84
-6.89%
jan 1, 2004
12.896
+1.55
13.67%
jan 1, 2005
13.071
+0.176
1.36%
jan 1, 2006
15.788
+2.717
20.78%
jan 1, 2007
15.776
-0.012
-0.07%
jan 1, 2008
15.518
-0.258
-1.64%
jan 1, 2009
12.683
-2.835
-18.27%
jan 1, 2010
10.934
-1.75
-13.8%
jan 1, 2011
10.933
0.0
0.0%
jan 1, 2012
15.306
+4.373
39.99%
jan 1, 2013
14.183
-1.123
-7.34%
jan 1, 2014
15.534
+1.35
9.52%
jan 1, 2015
16.653
+1.12
7.21%
Ranking of countries by current statistics by years