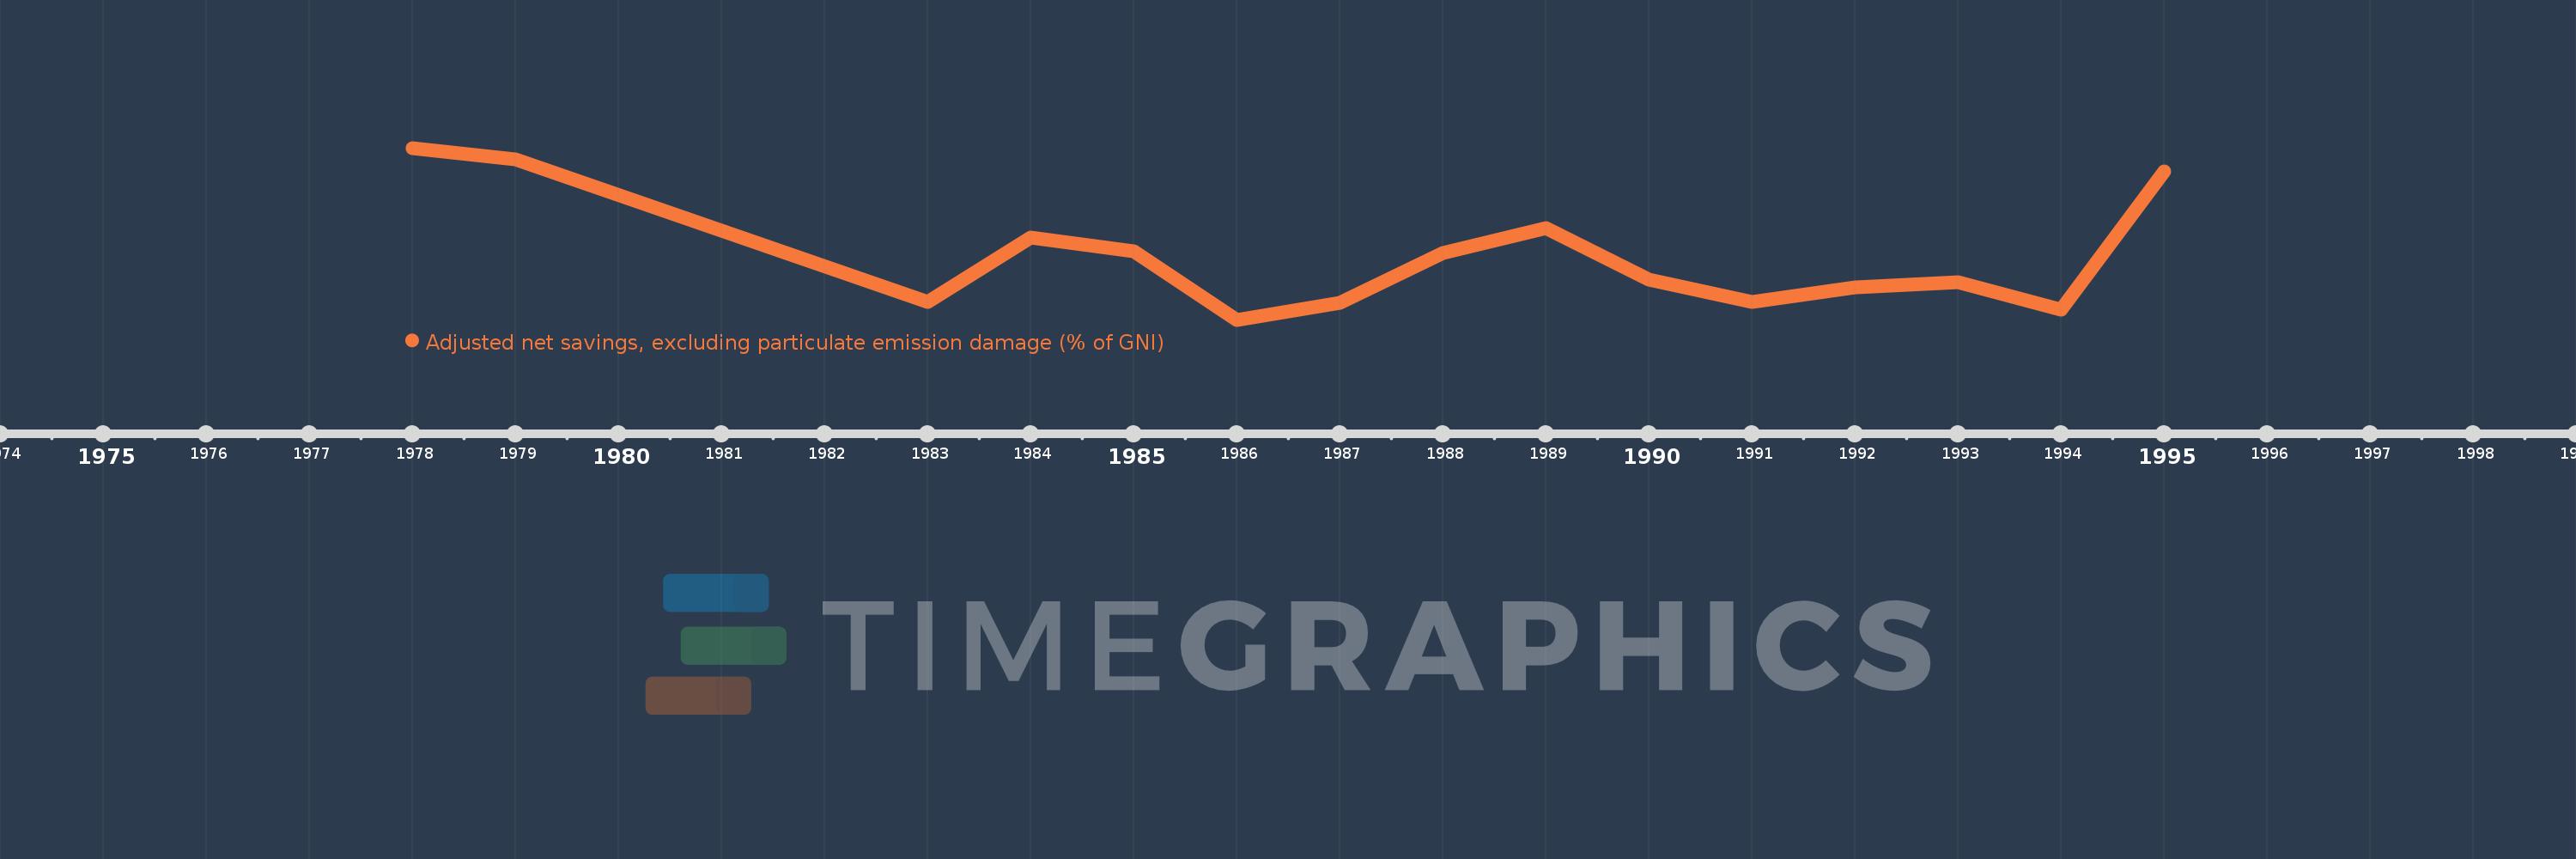
This timeline shows a graph from 1978 to 1995 of Chad. No data until 1977. Number of actual observations by date: 15.
Source name:
World Development Indicators
Source organization:
World Bank staff estimates based on sources and methods in World Bank's "The Changing Wealth of Nations: Measuring Sustainable Development in the New Millennium" (2011).
Categories, topics:
Economy & Growth, Environment
Last updated:
apr 23, 2017
Indicators value changes by year
Meaning:
1.163
Minimum:
-4.291
jan 1, 1986
Maximum:
10.315
jan 1, 1978
At the date of observation
Value
Absolute change
Change from the previous value
jan 1, 1978
10.315
+10.315
0.0%
jan 1, 1979
9.325
-0.991
-9.6%
jan 1, 1983
-2.815
-12.14
-130.19%
jan 1, 1984
2.701
+5.516
-195.92%
jan 1, 1985
1.52
-1.181
-43.72%
jan 1, 1986
-4.291
-5.811
-382.31%
jan 1, 1987
-2.873
+1.418
-33.05%
jan 1, 1988
1.363
+4.236
-147.45%
jan 1, 1989
3.536
+2.173
159.43%
jan 1, 1990
-0.861
-4.397
-124.34%
jan 1, 1991
-2.768
-1.908
221.63%
jan 1, 1992
-1.562
+1.206
-43.56%
jan 1, 1993
-1.08
+0.483
-30.89%
jan 1, 1994
-3.401
-2.321
214.96%
jan 1, 1995
8.337
+11.738
-345.14%
Ranking of countries by current statistics by years