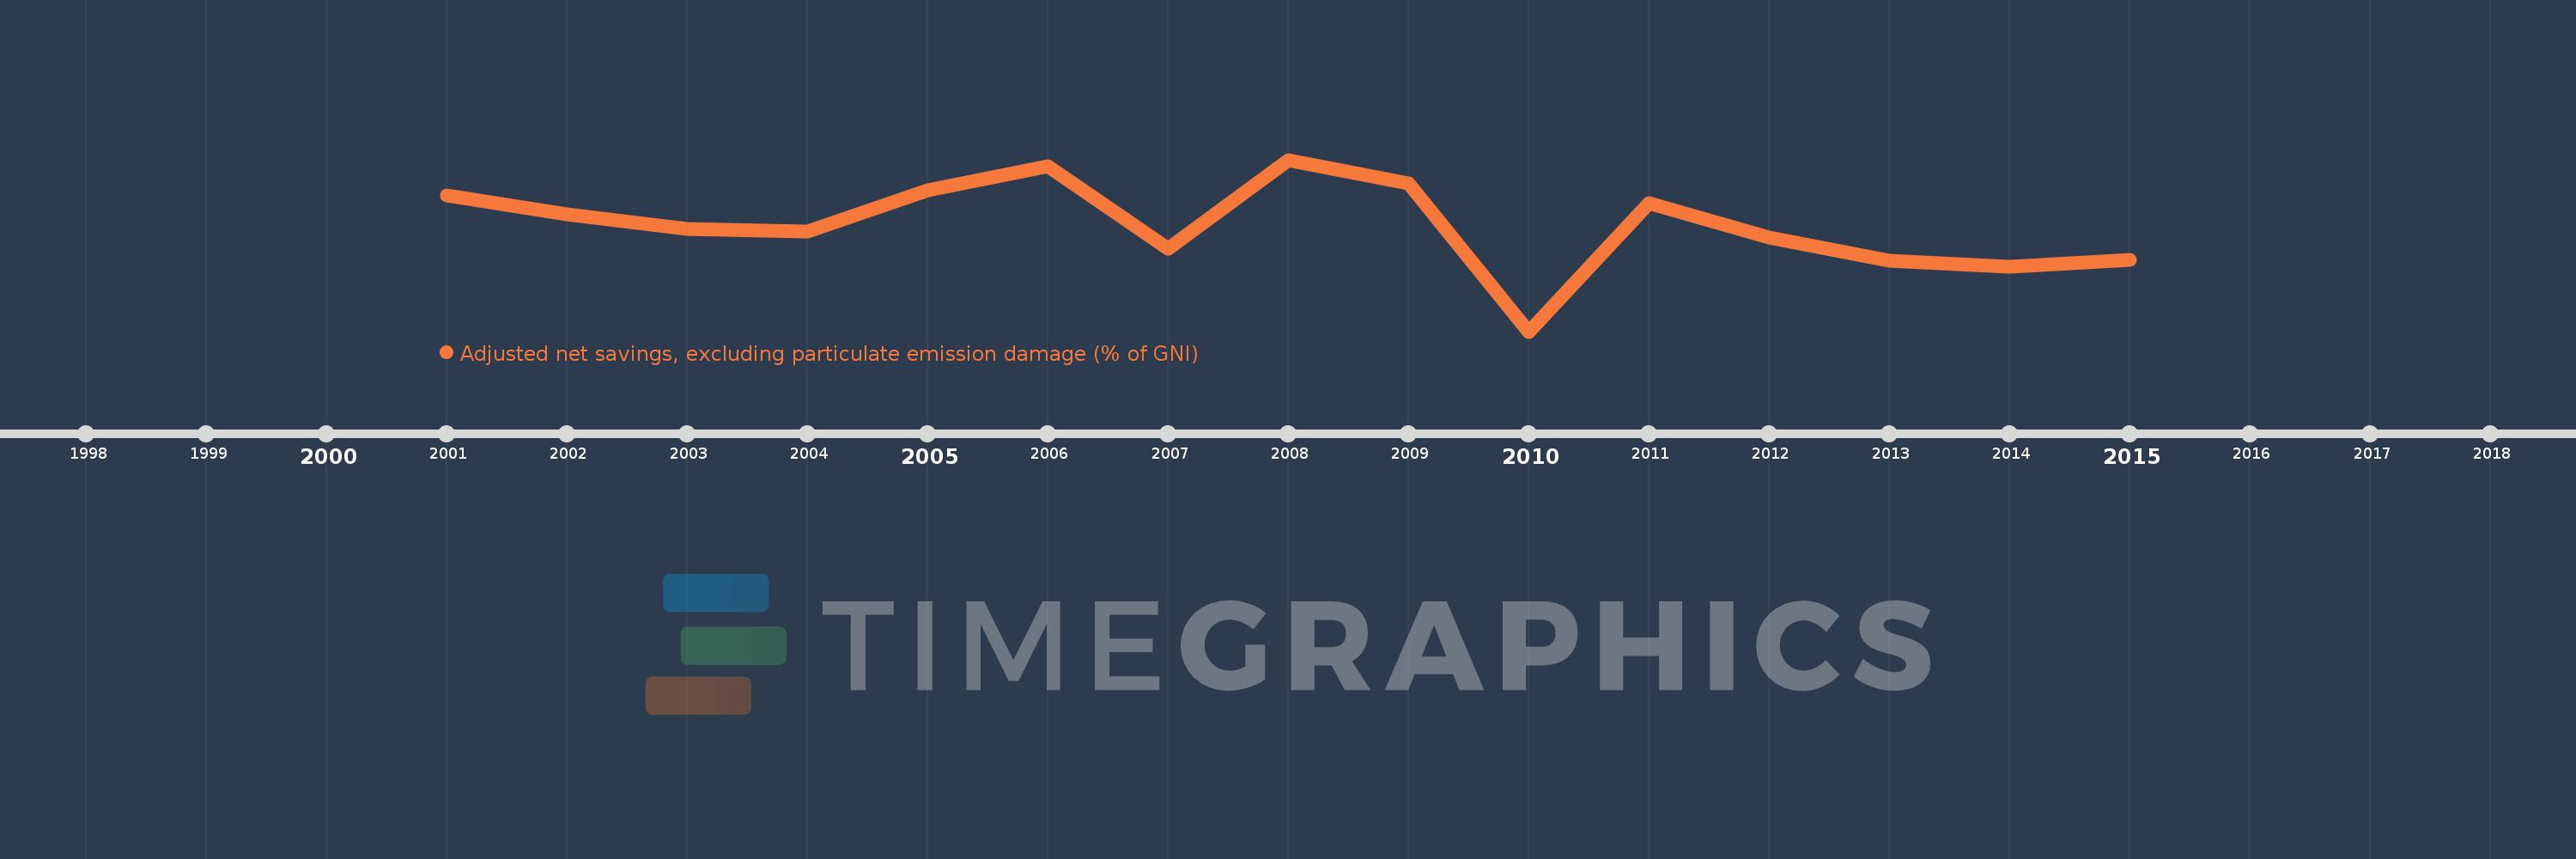
This timeline shows a graph from 2001 to 2015 of Luxembourg. No data until 2000. Number of actual observations by date: 15.
Source name:
World Development Indicators
Source organization:
World Bank staff estimates based on sources and methods in World Bank's "The Changing Wealth of Nations: Measuring Sustainable Development in the New Millennium" (2011).
Categories, topics:
Economy & Growth, Environment
Last updated:
apr 23, 2017
Indicators value changes by year
Meaning:
17.026
Minimum:
3.473
jan 1, 2010
Maximum:
25.362
jan 1, 2008
At the date of observation
Value
Absolute change
Change from the previous value
jan 1, 2001
20.78
+20.78
0.0%
jan 1, 2002
18.433
-2.347
-11.29%
jan 1, 2003
16.526
-1.907
-10.34%
jan 1, 2004
16.273
-0.253
-1.53%
jan 1, 2005
21.468
+5.195
31.92%
jan 1, 2006
24.527
+3.059
14.25%
jan 1, 2007
14.008
-10.519
-42.89%
jan 1, 2008
25.362
+11.353
81.05%
jan 1, 2009
22.402
-2.96
-11.67%
jan 1, 2010
3.473
-18.929
-84.5%
jan 1, 2011
19.784
+16.311
469.64%
jan 1, 2012
15.43
-4.354
-22.01%
jan 1, 2013
12.526
-2.903
-18.82%
jan 1, 2014
11.738
-0.788
-6.29%
jan 1, 2015
12.657
+0.919
7.83%
Ranking of countries by current statistics by years