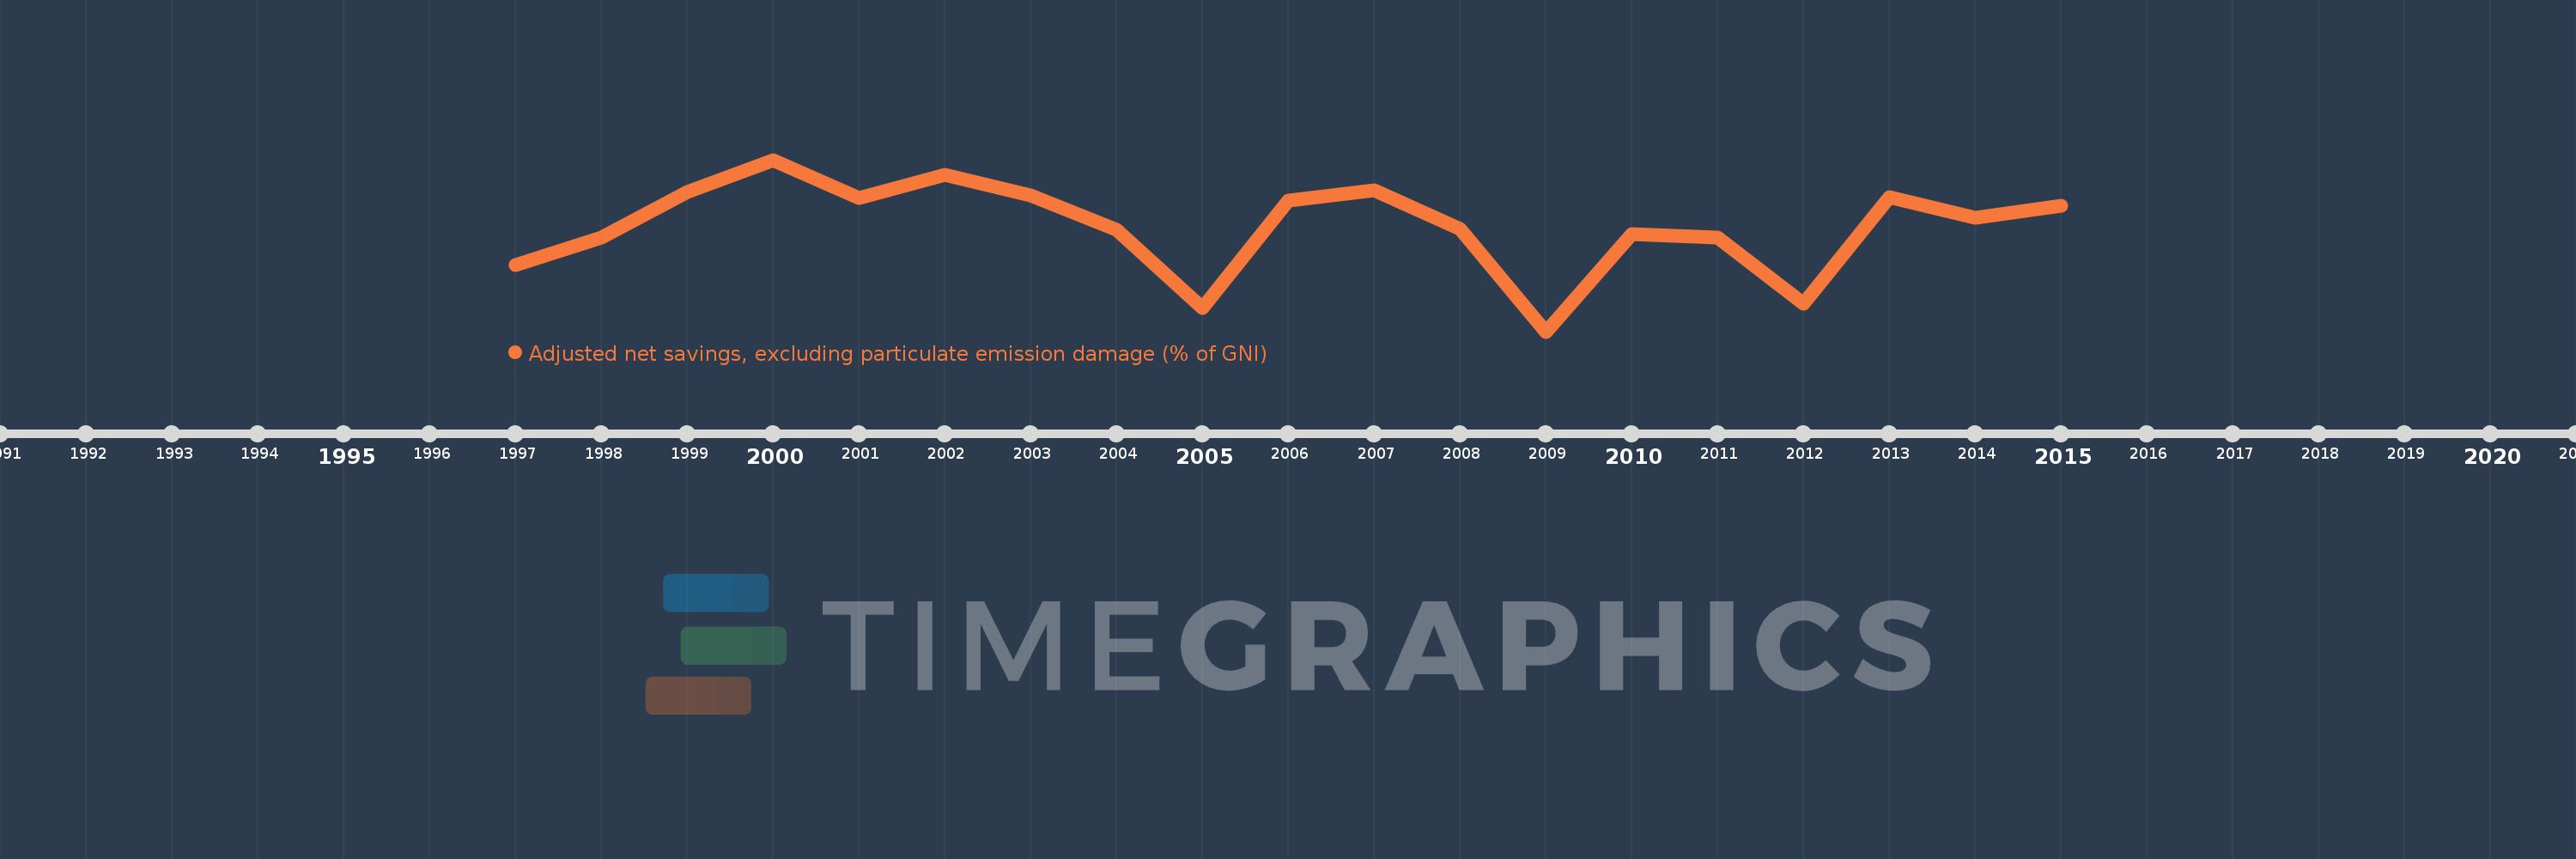
This timeline shows a graph from 1997 to 2015 of Vietnam. No data until 1996. Number of actual observations by date: 19.
Source name:
World Development Indicators
Source organization:
World Bank staff estimates based on sources and methods in World Bank's "The Changing Wealth of Nations: Measuring Sustainable Development in the New Millennium" (2011).
Categories, topics:
Economy & Growth, Environment
Last updated:
apr 23, 2017
Indicators value changes by year
Meaning:
13.844
Minimum:
5.977
jan 1, 2009
Maximum:
18.866
jan 1, 2000
At the date of observation
Value
Absolute change
Change from the previous value
jan 1, 1997
10.955
+10.955
0.0%
jan 1, 1998
13.011
+2.056
18.77%
jan 1, 1999
16.464
+3.453
26.54%
jan 1, 2000
18.866
+2.402
14.59%
jan 1, 2001
16.016
-2.85
-15.11%
jan 1, 2002
17.767
+1.751
10.94%
jan 1, 2003
16.171
-1.597
-8.99%
jan 1, 2004
13.604
-2.567
-15.87%
jan 1, 2005
7.763
-5.841
-42.93%
jan 1, 2006
15.78
+8.016
103.26%
jan 1, 2007
16.609
+0.83
5.26%
jan 1, 2008
13.66
-2.95
-17.76%
jan 1, 2009
5.977
-7.683
-56.25%
jan 1, 2010
13.279
+7.302
122.18%
jan 1, 2011
13.056
-0.223
-1.68%
jan 1, 2012
8.064
-4.992
-38.23%
jan 1, 2013
16.043
+7.979
98.94%
jan 1, 2014
14.541
-1.502
-9.36%
jan 1, 2015
15.407
+0.866
5.95%
Ranking of countries by current statistics by years