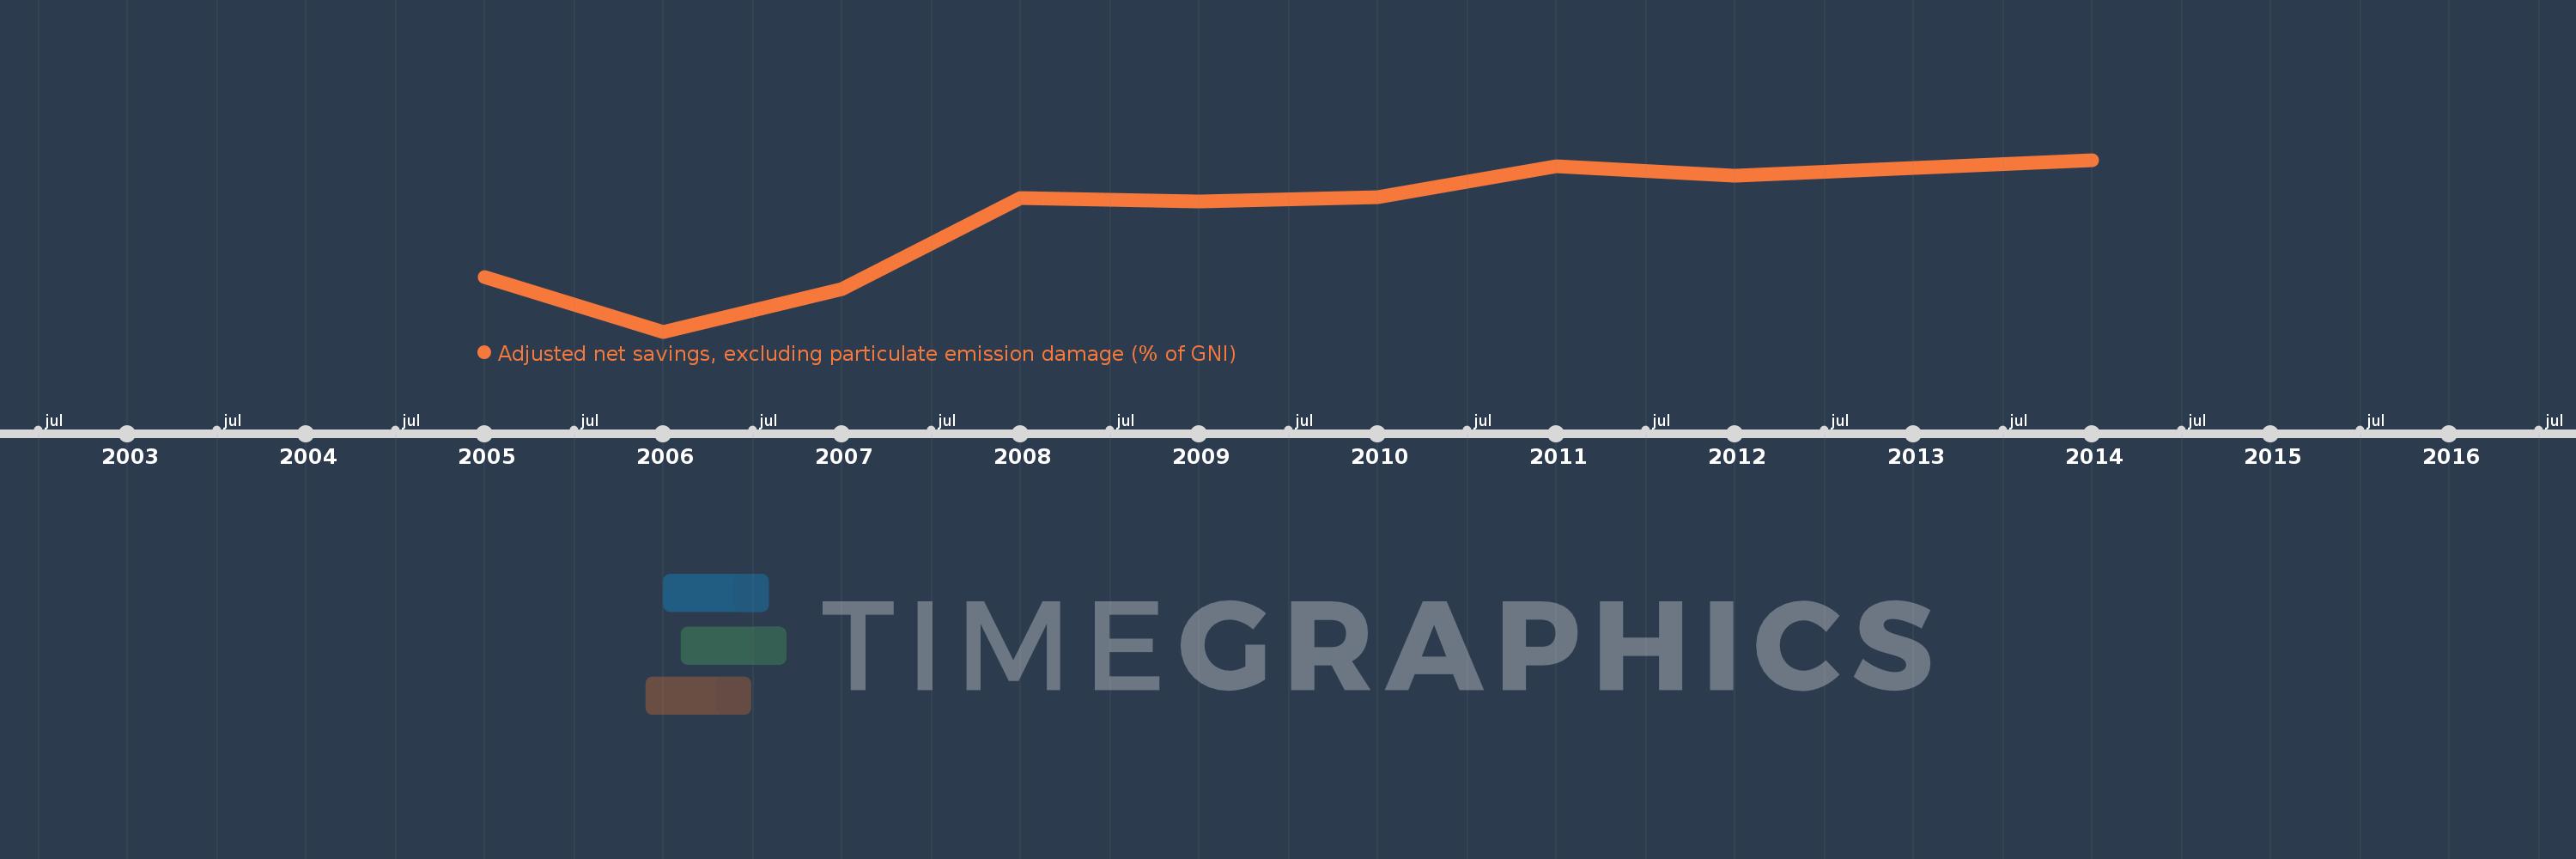
This timeline shows a graph from 2005 to 2014 of Tajikistan. No data until 2004. Number of actual observations by date: 10.
Source name:
World Development Indicators
Source organization:
World Bank staff estimates based on sources and methods in World Bank's "The Changing Wealth of Nations: Measuring Sustainable Development in the New Millennium" (2011).
Categories, topics:
Economy & Growth, Environment
Last updated:
apr 23, 2017
Indicators value changes by year
Meaning:
4.415
Minimum:
-16.676
jan 1, 2006
Maximum:
14.78
jan 1, 2014
At the date of observation
Value
Absolute change
Change from the previous value
jan 1, 2005
-6.739
-6.739
0.0%
jan 1, 2006
-16.676
-9.936
147.44%
jan 1, 2007
-8.965
+7.711
-46.24%
jan 1, 2008
7.785
+16.75
-186.84%
jan 1, 2009
7.197
-0.589
-7.56%
jan 1, 2010
7.968
+0.771
10.71%
jan 1, 2011
13.614
+5.647
70.87%
jan 1, 2012
11.846
-1.768
-12.99%
jan 1, 2013
13.338
+1.492
12.6%
jan 1, 2014
14.78
+1.442
10.81%
Ranking of countries by current statistics by years