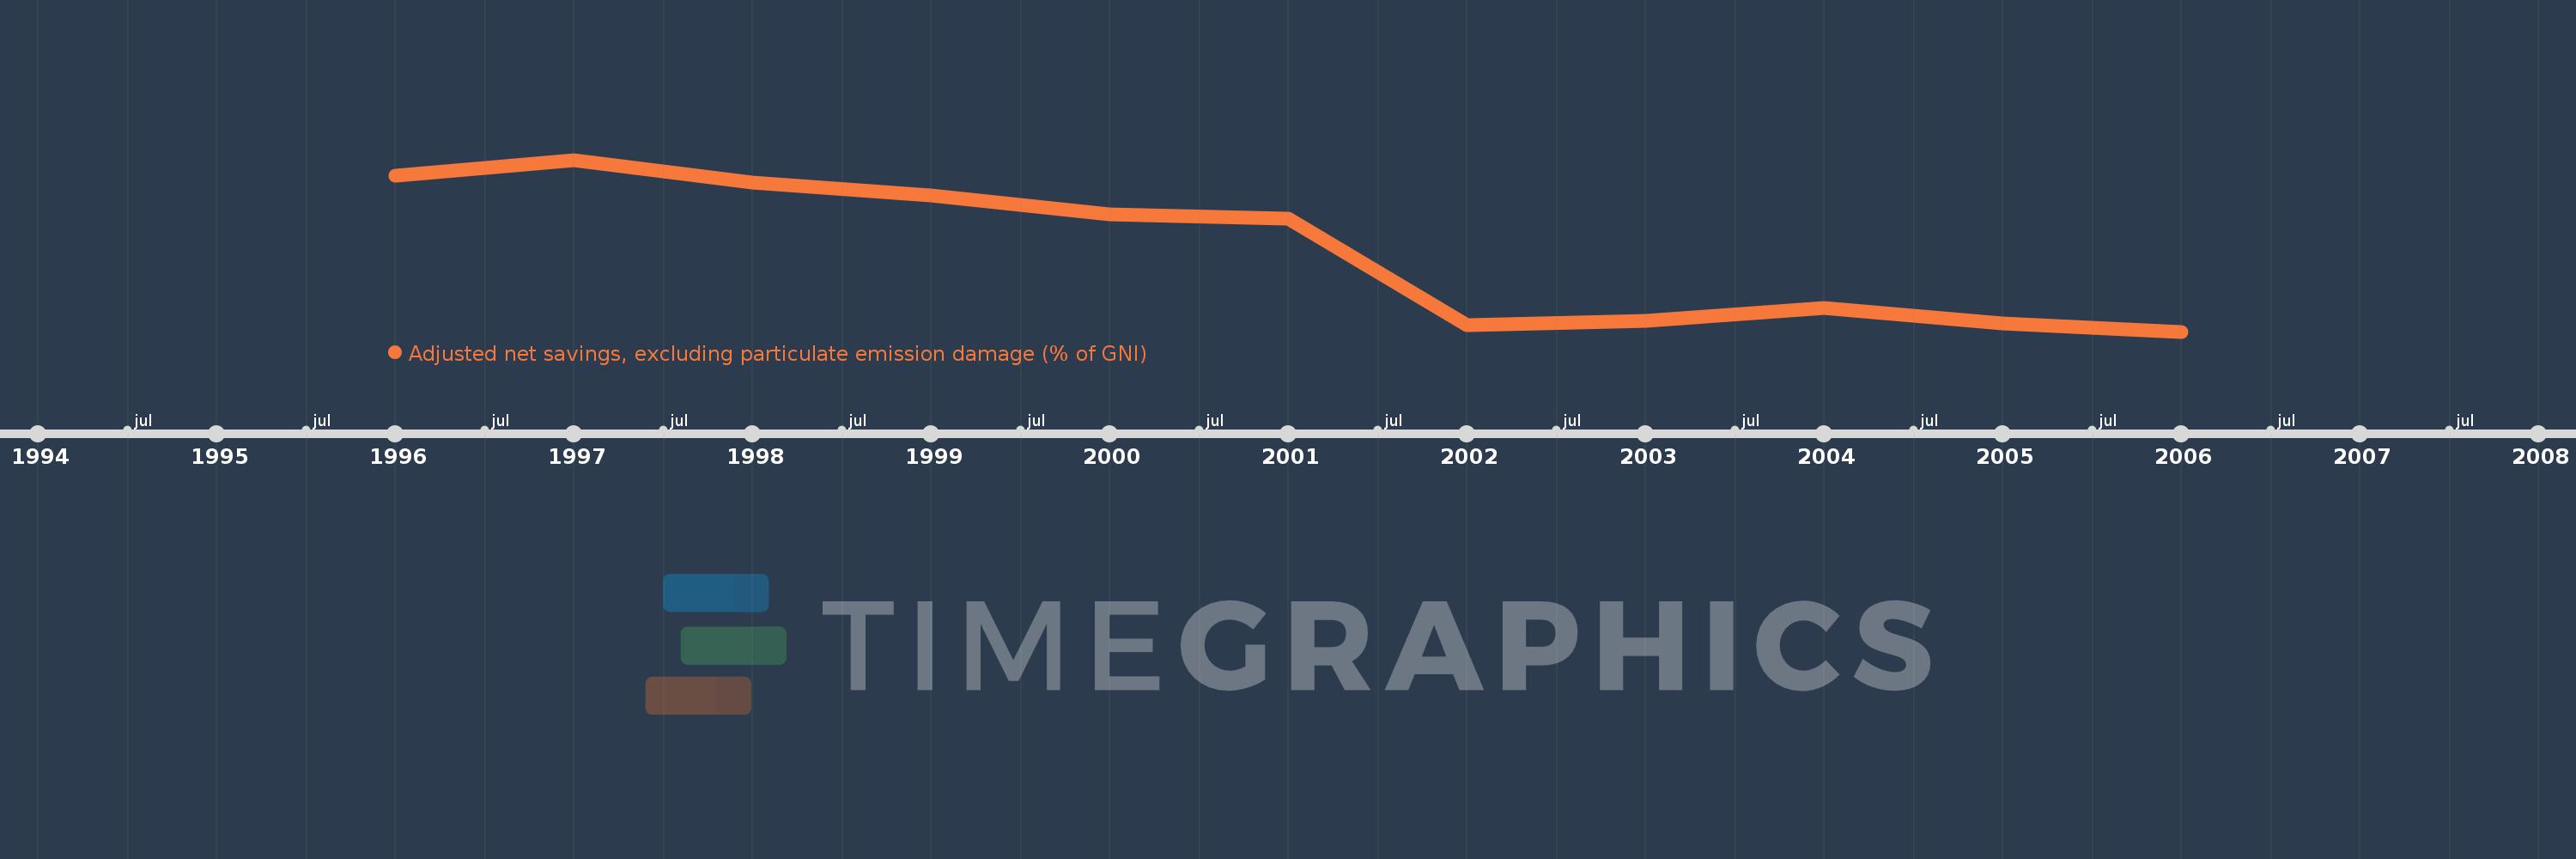
This timeline shows a graph from 1996 to 2006 of Maldives. No data until 1995. Number of actual observations by date: 11.
Source name:
World Development Indicators
Source organization:
World Bank staff estimates based on sources and methods in World Bank's "The Changing Wealth of Nations: Measuring Sustainable Development in the New Millennium" (2011).
Categories, topics:
Economy & Growth, Environment
Last updated:
apr 23, 2017
Indicators value changes by year
Meaning:
26.236
Minimum:
8.643
jan 1, 2006
Maximum:
45.942
jan 1, 1997
At the date of observation
Value
Absolute change
Change from the previous value
jan 1, 1996
42.504
+42.504
0.0%
jan 1, 1997
45.942
+3.437
8.09%
jan 1, 1998
40.911
-5.031
-10.95%
jan 1, 1999
38.167
-2.744
-6.71%
jan 1, 2000
34.063
-4.104
-10.75%
jan 1, 2001
33.177
-0.885
-2.6%
jan 1, 2002
9.968
-23.209
-69.95%
jan 1, 2003
11.029
+1.061
10.64%
jan 1, 2004
13.775
+2.746
24.9%
jan 1, 2005
10.418
-3.357
-24.37%
jan 1, 2006
8.643
-1.775
-17.04%
Ranking of countries by current statistics by years