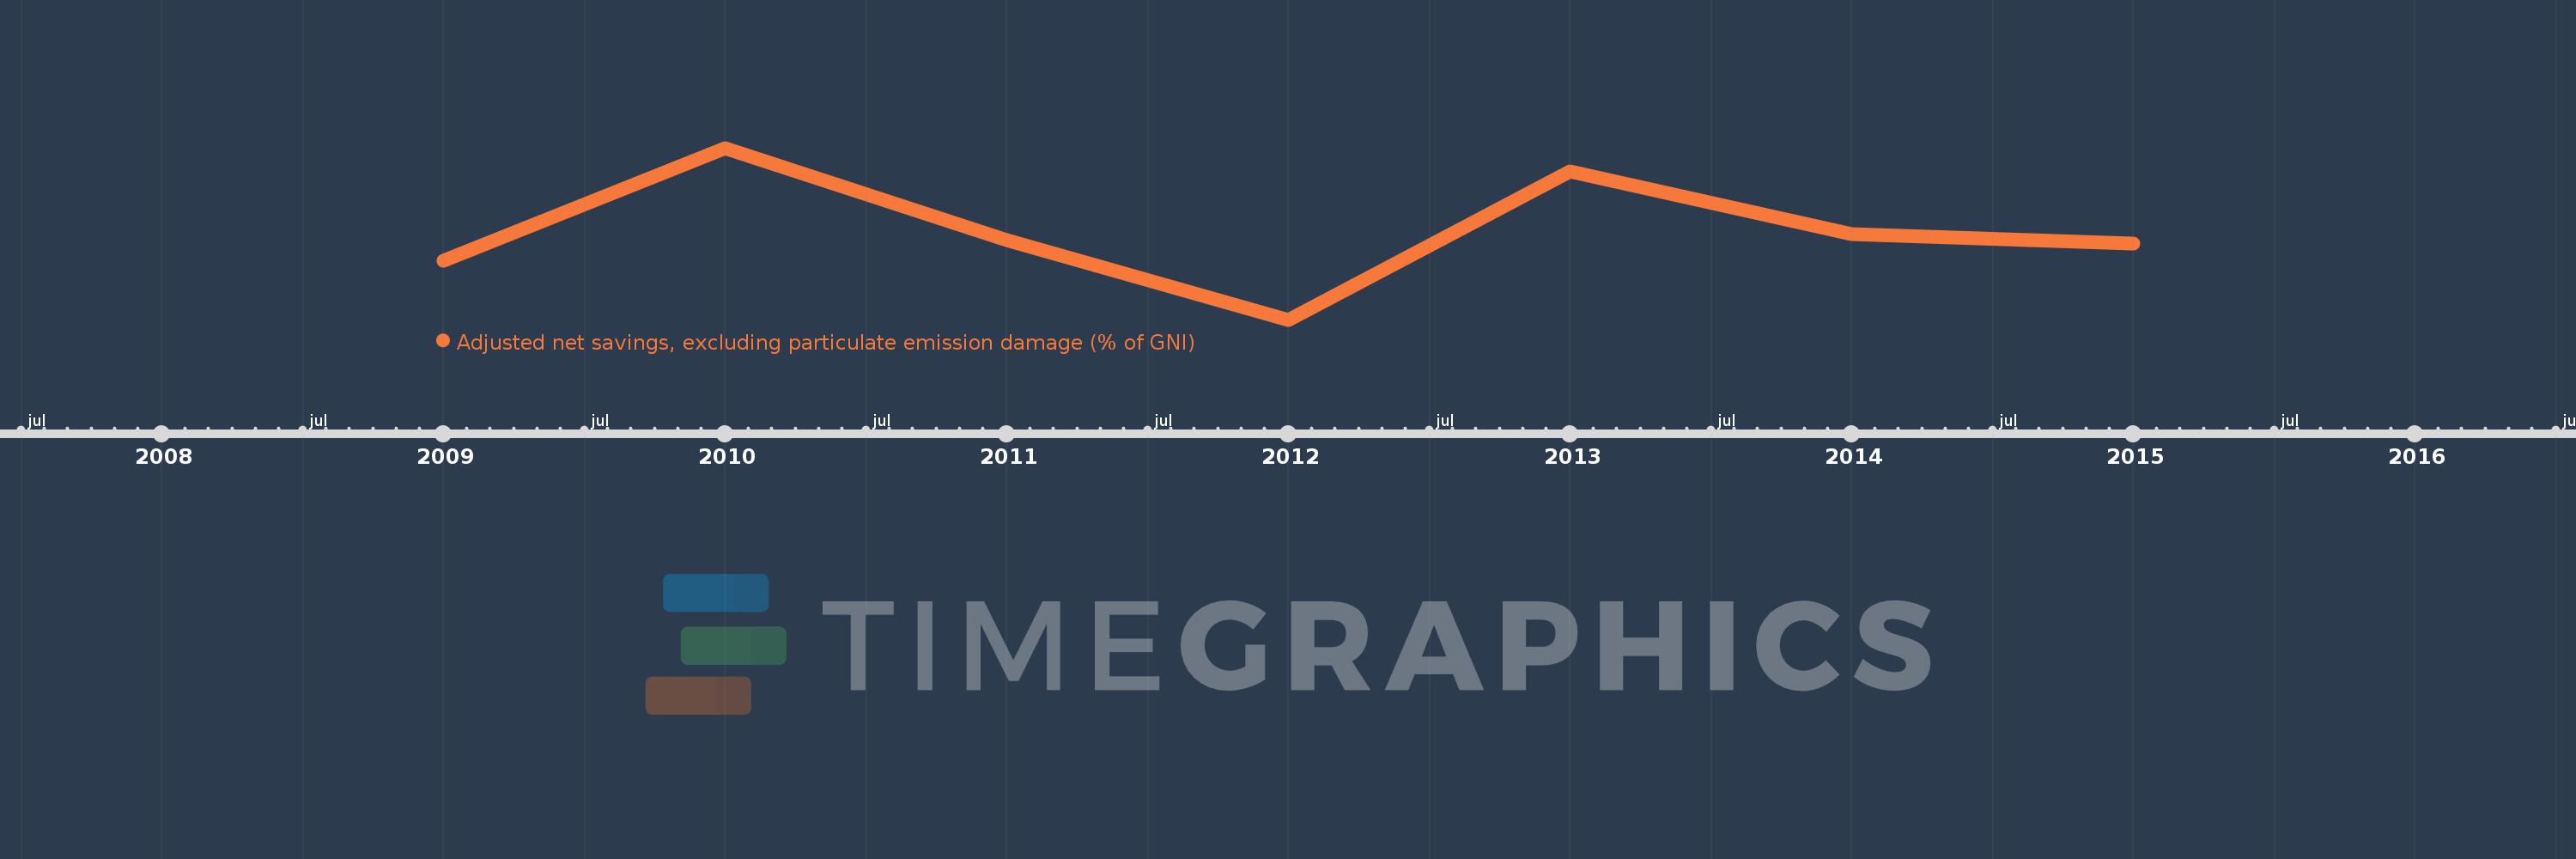
This timeline shows a graph from 2009 to 2015 of Afghanistan. No data until 2008. Number of actual observations by date: 7.
Source name:
World Development Indicators
Source organization:
World Bank staff estimates based on sources and methods in World Bank's "The Changing Wealth of Nations: Measuring Sustainable Development in the New Millennium" (2011).
Categories, topics:
Economy & Growth, Environment
Last updated:
apr 23, 2017
Indicators value changes by year
Meaning:
-14.479
Minimum:
-21.305
jan 1, 2012
Maximum:
-8.069
jan 1, 2010
At the date of observation
Value
Absolute change
Change from the previous value
jan 1, 2009
-16.751
-16.751
0.0%
jan 1, 2010
-8.069
+8.682
-51.83%
jan 1, 2011
-15.172
-7.103
88.03%
jan 1, 2012
-21.305
-6.133
40.42%
jan 1, 2013
-9.88
+11.425
-53.62%
jan 1, 2014
-14.713
-4.832
48.91%
jan 1, 2015
-15.461
-0.748
5.08%
Ranking of countries by current statistics by years