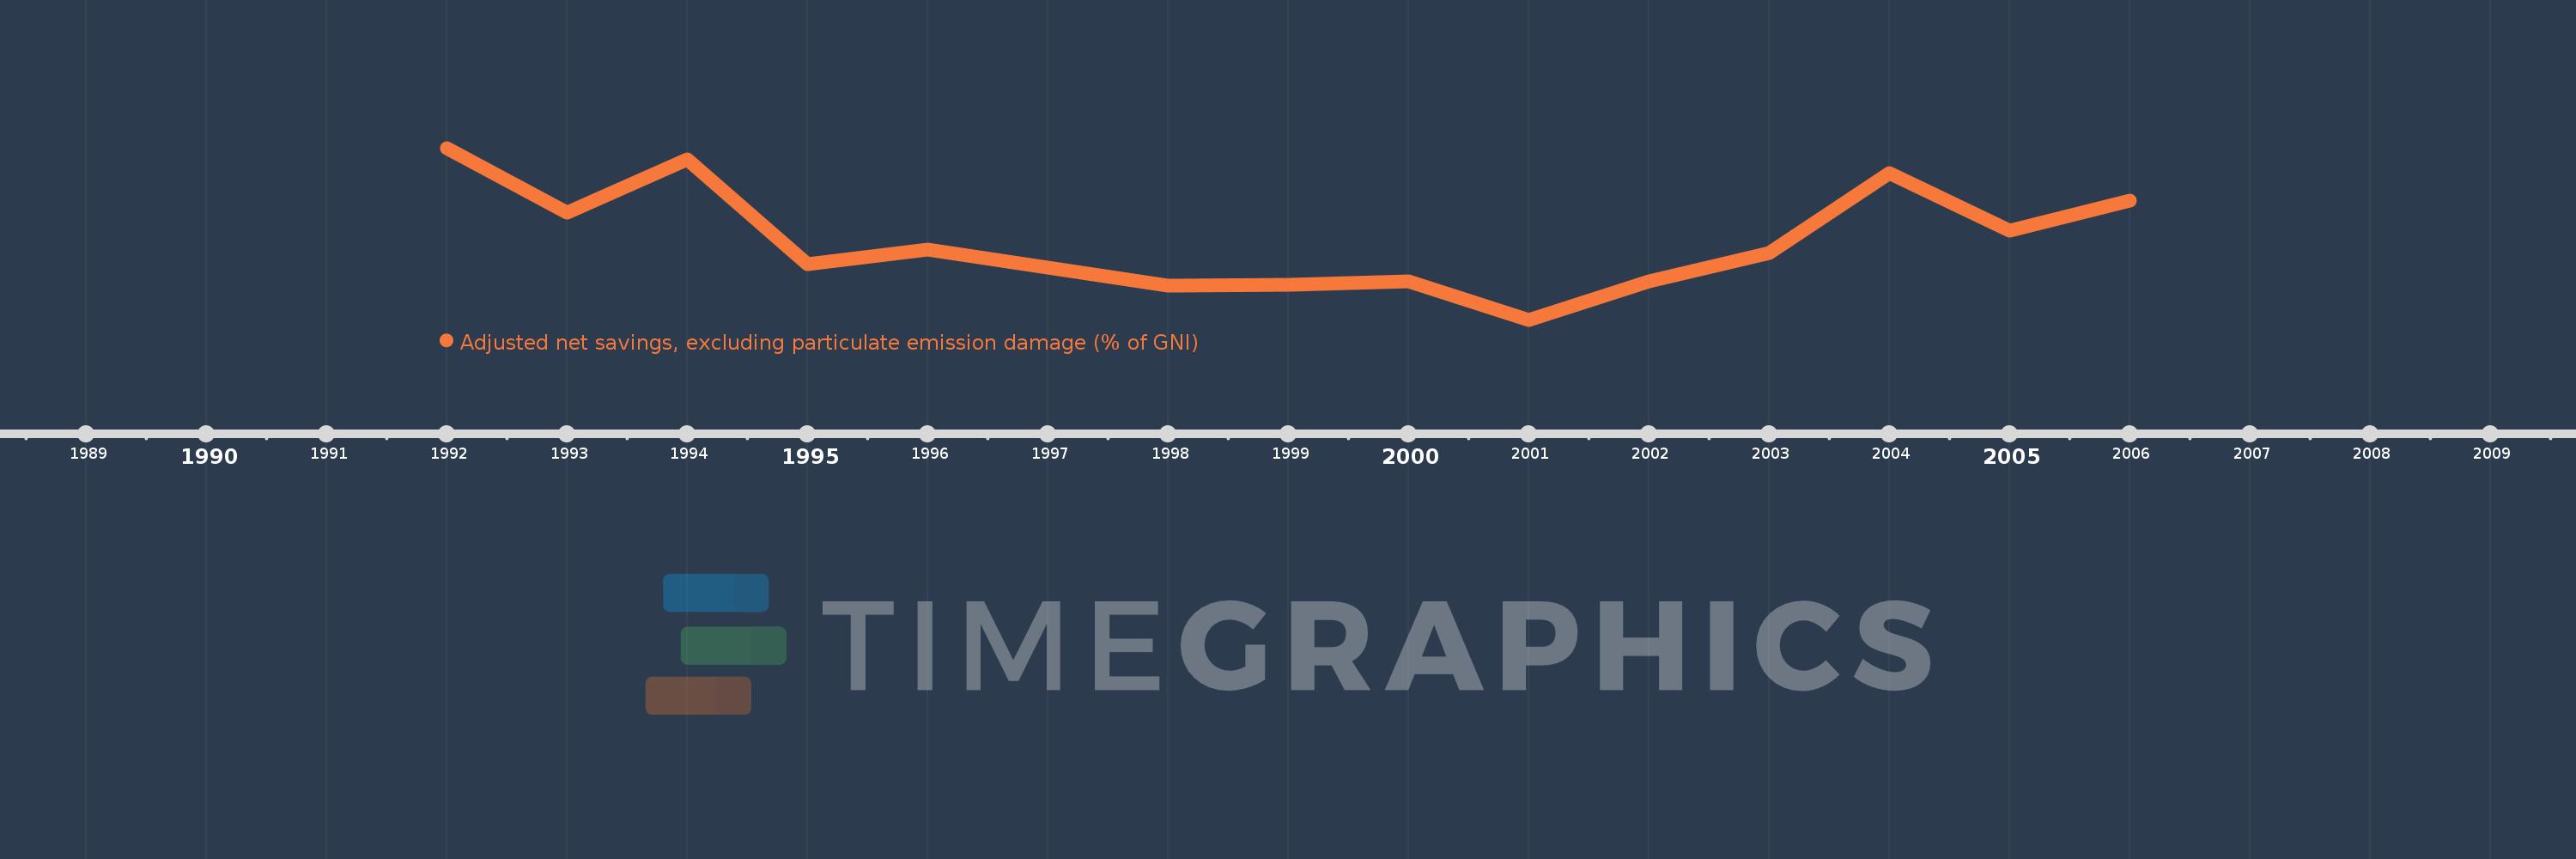
This timeline shows a graph from 1992 to 2006 of Djibouti. No data until 1991. Number of actual observations by date: 15.
Source name:
World Development Indicators
Source organization:
World Bank staff estimates based on sources and methods in World Bank's "The Changing Wealth of Nations: Measuring Sustainable Development in the New Millennium" (2011).
Categories, topics:
Economy & Growth, Environment
Last updated:
apr 23, 2017
Indicators value changes by year
Meaning:
18.441
Minimum:
10.301
jan 1, 2001
Maximum:
28.027
jan 1, 1992
At the date of observation
Value
Absolute change
Change from the previous value
jan 1, 1992
28.027
+28.027
0.0%
jan 1, 1993
21.365
-6.663
-23.77%
jan 1, 1994
26.875
+5.51
25.79%
jan 1, 1995
16.035
-10.84
-40.33%
jan 1, 1996
17.521
+1.486
9.27%
jan 1, 1997
15.666
-1.855
-10.59%
jan 1, 1998
13.781
-1.884
-12.03%
jan 1, 1999
13.876
+0.095
0.69%
jan 1, 2000
14.268
+0.391
2.82%
jan 1, 2001
10.301
-3.966
-27.8%
jan 1, 2002
14.219
+3.918
38.03%
jan 1, 2003
17.206
+2.987
21.0%
jan 1, 2004
25.47
+8.264
48.03%
jan 1, 2005
19.456
-6.014
-23.61%
jan 1, 2006
22.556
+3.099
15.93%
Ranking of countries by current statistics by years