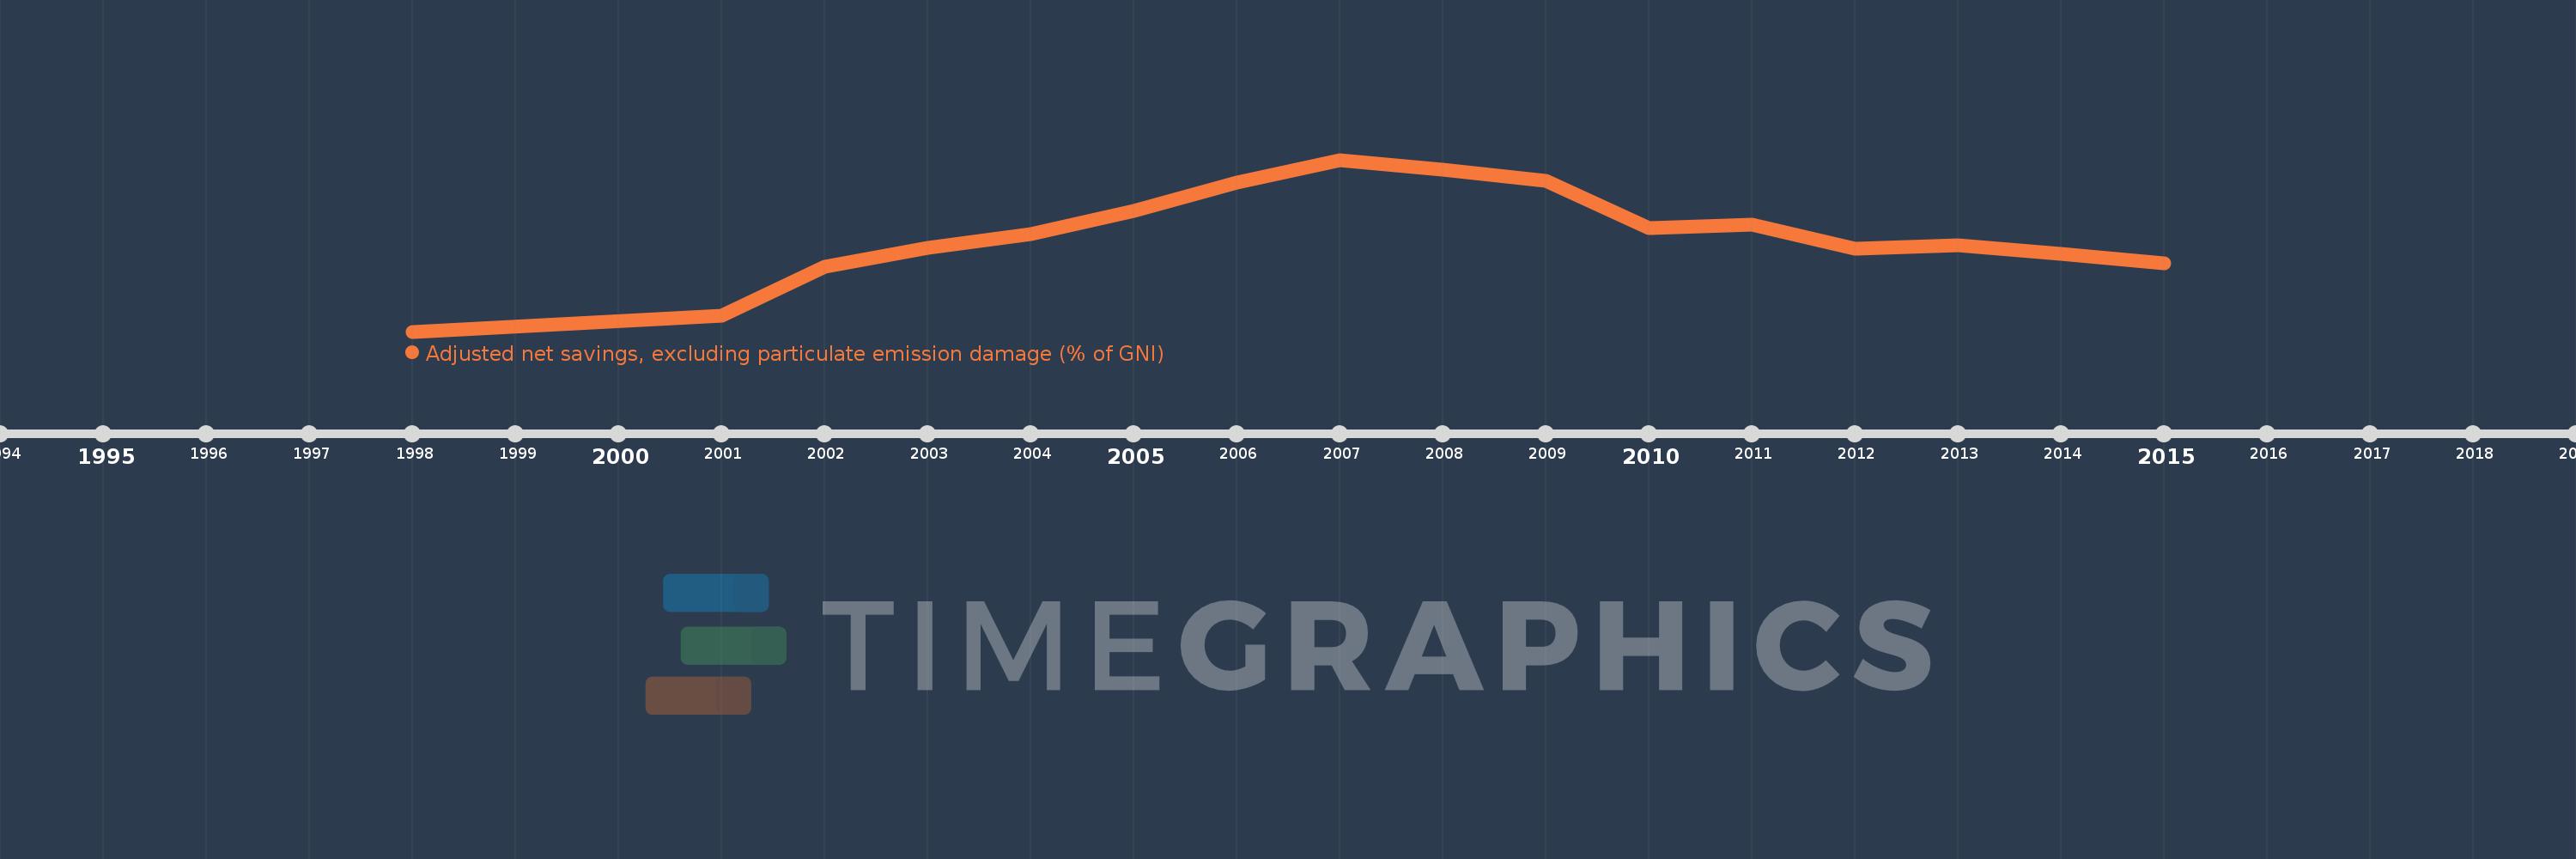
This timeline shows a graph from 1998 to 2015 of Armenia. No data until 1997. Number of actual observations by date: 16.
Source name:
World Development Indicators
Source organization:
World Bank staff estimates based on sources and methods in World Bank's "The Changing Wealth of Nations: Measuring Sustainable Development in the New Millennium" (2011).
Categories, topics:
Economy & Growth, Environment
Last updated:
apr 23, 2017
Indicators value changes by year
Meaning:
6.657
Minimum:
-13.411
jan 1, 1998
Maximum:
22.305
jan 1, 2007
At the date of observation
Value
Absolute change
Change from the previous value
jan 1, 1998
-13.411
-13.411
0.0%
jan 1, 2001
-10.136
+3.275
-24.42%
jan 1, 2002
0.111
+10.247
-101.1%
jan 1, 2003
4.046
+3.934
3.53K%
jan 1, 2004
6.879
+2.833
70.03%
jan 1, 2005
11.722
+4.843
70.4%
jan 1, 2006
17.578
+5.857
49.96%
jan 1, 2007
22.305
+4.727
26.89%
jan 1, 2008
20.266
-2.04
-9.14%
jan 1, 2009
17.959
-2.307
-11.38%
jan 1, 2010
8.161
-9.798
-54.56%
jan 1, 2011
8.856
+0.695
8.51%
jan 1, 2012
3.848
-5.007
-56.55%
jan 1, 2013
4.622
+0.774
20.12%
jan 1, 2014
2.838
-1.784
-38.6%
jan 1, 2015
0.872
-1.966
-69.27%
Ranking of countries by current statistics by years