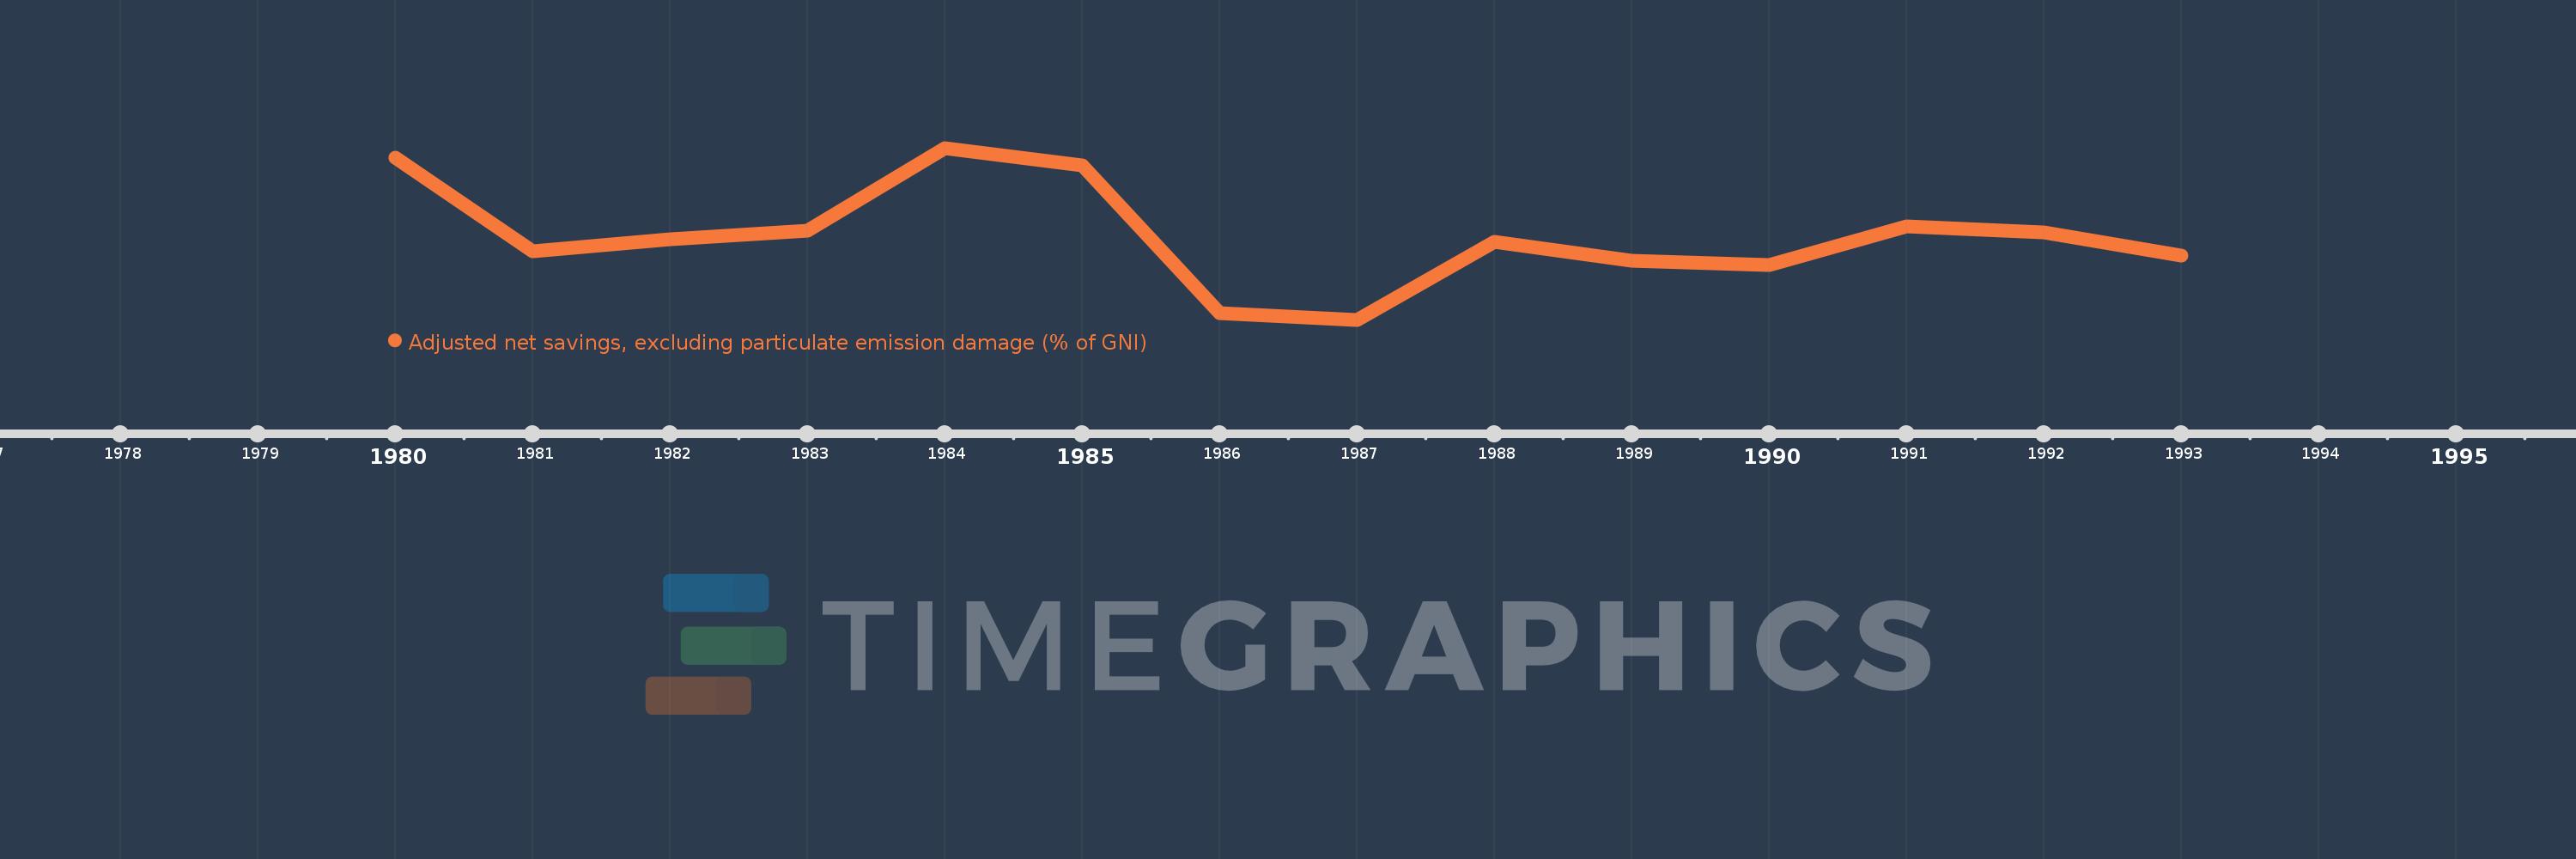
This timeline shows a graph from 1980 to 1993 of Kiribati. No data until 1979. Number of actual observations by date: 14.
Source name:
World Development Indicators
Source organization:
World Bank staff estimates based on sources and methods in World Bank's "The Changing Wealth of Nations: Measuring Sustainable Development in the New Millennium" (2011).
Categories, topics:
Economy & Growth, Environment
Last updated:
apr 23, 2017
Indicators value changes by year
Meaning:
34.254
Minimum:
16.81
jan 1, 1987
Maximum:
52.683
jan 1, 1984
At the date of observation
Value
Absolute change
Change from the previous value
jan 1, 1980
50.581
+50.581
0.0%
jan 1, 1981
31.059
-19.522
-38.6%
jan 1, 1982
33.582
+2.523
8.12%
jan 1, 1983
35.384
+1.802
5.37%
jan 1, 1984
52.683
+17.298
48.89%
jan 1, 1985
49.077
-3.606
-6.84%
jan 1, 1986
18.187
-30.889
-62.94%
jan 1, 1987
16.81
-1.377
-7.57%
jan 1, 1988
33.14
+16.33
97.14%
jan 1, 1989
29.176
-3.964
-11.96%
jan 1, 1990
28.321
-0.855
-2.93%
jan 1, 1991
36.385
+8.064
28.47%
jan 1, 1992
34.989
-1.397
-3.84%
jan 1, 1993
30.179
-4.809
-13.75%
Ranking of countries by current statistics by years