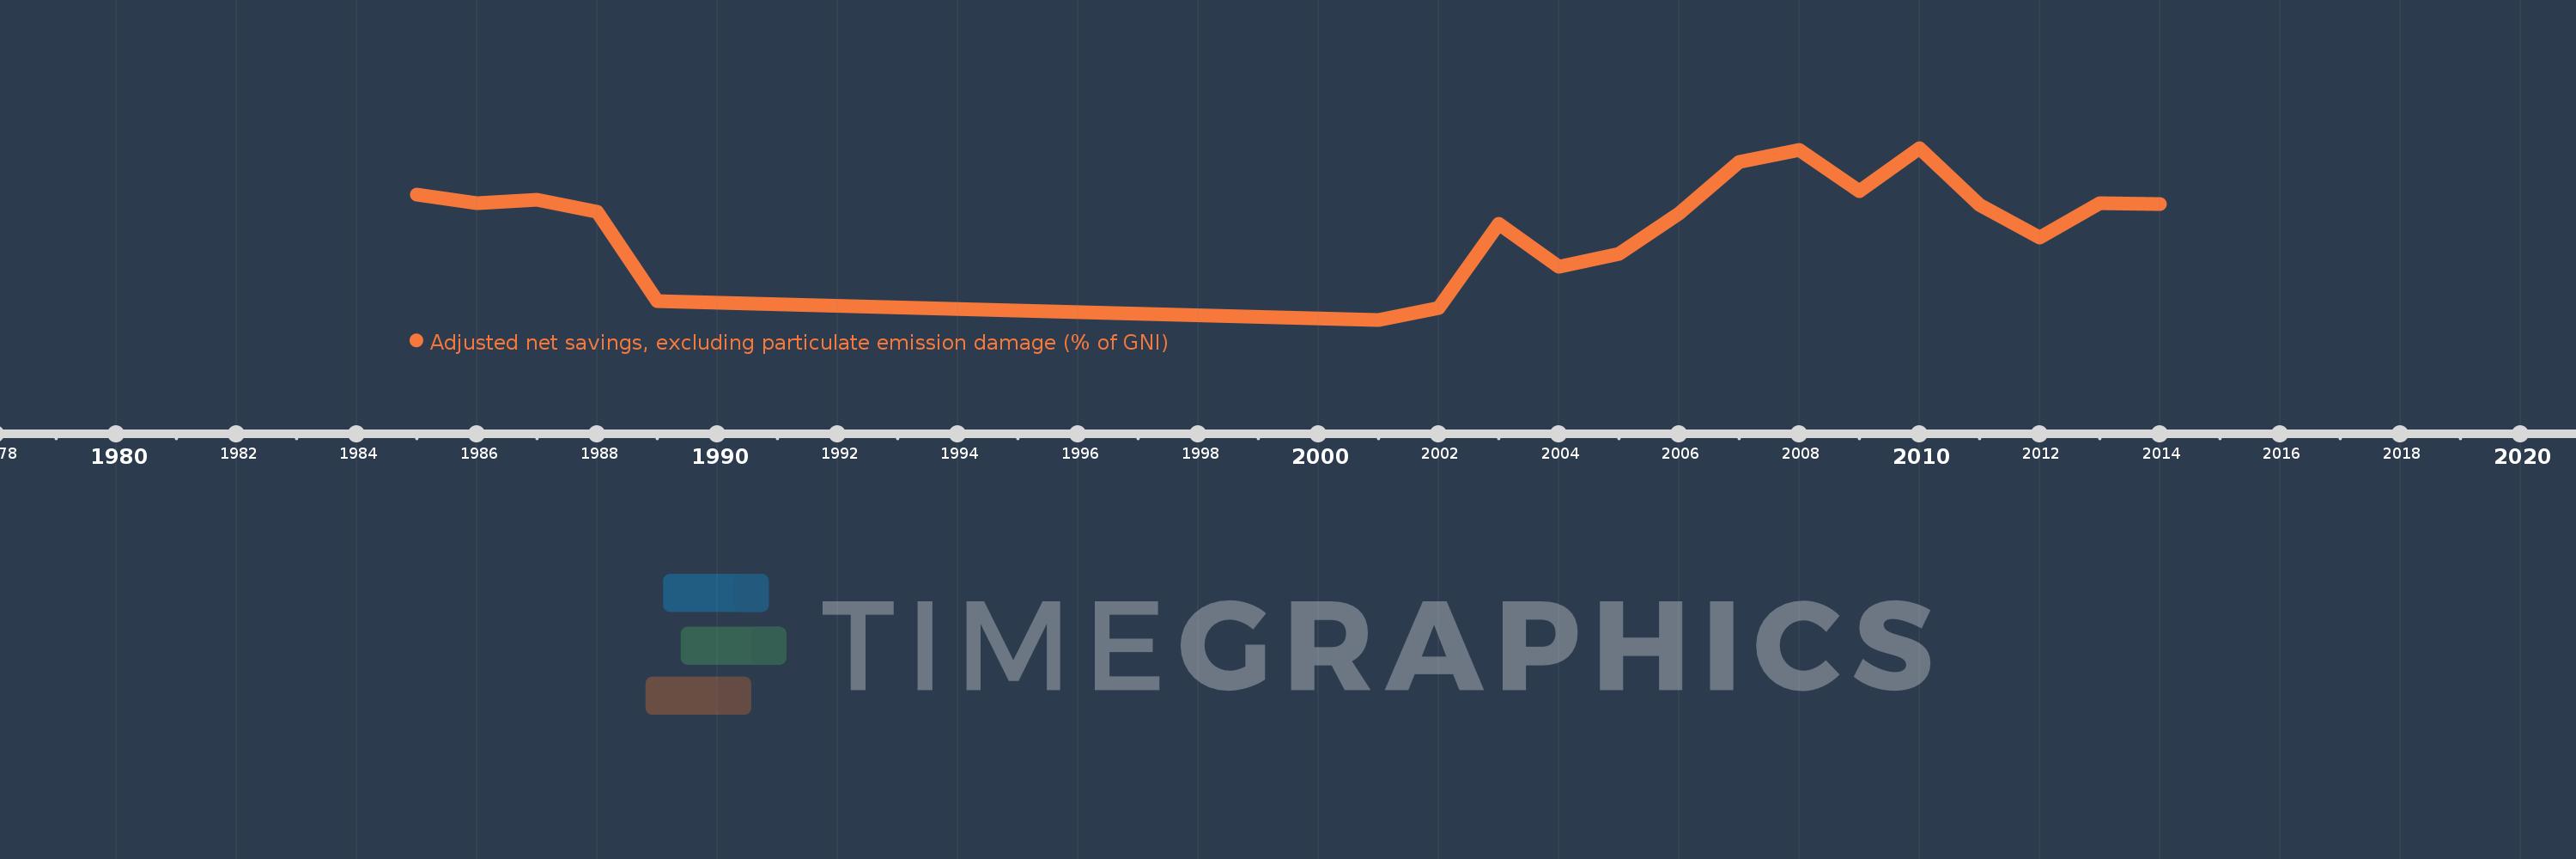
This timeline shows a graph from 1985 to 2014 of Lao PDR. No data until 1984. Number of actual observations by date: 19.
Source name:
World Development Indicators
Source organization:
World Bank staff estimates based on sources and methods in World Bank's "The Changing Wealth of Nations: Measuring Sustainable Development in the New Millennium" (2011).
Categories, topics:
Economy & Growth, Environment
Last updated:
apr 23, 2017
Indicators value changes by year
Meaning:
-4.76
Minimum:
-14.504
jan 1, 2001
Maximum:
2.431
jan 1, 2010
At the date of observation
Value
Absolute change
Change from the previous value
jan 1, 1985
-2.143
-2.143
0.0%
jan 1, 1986
-2.991
-0.847
39.53%
jan 1, 1987
-2.652
+0.339
-11.34%
jan 1, 1988
-3.897
-1.245
46.95%
jan 1, 1989
-12.707
-8.81
226.07%
jan 1, 2001
-14.504
-1.797
14.15%
jan 1, 2002
-13.336
+1.168
-8.05%
jan 1, 2003
-5.078
+8.258
-61.92%
jan 1, 2004
-9.272
-4.194
82.6%
jan 1, 2005
-7.998
+1.275
-13.75%
jan 1, 2006
-4.012
+3.986
-49.84%
jan 1, 2007
1.009
+5.021
-125.16%
jan 1, 2008
2.204
+1.195
118.41%
jan 1, 2009
-1.866
-4.07
-184.64%
jan 1, 2010
2.431
+4.297
-230.32%
jan 1, 2011
-3.153
-5.584
-229.68%
jan 1, 2012
-6.386
-3.233
102.54%
jan 1, 2013
-3.007
+3.379
-52.91%
jan 1, 2014
-3.077
-0.07
2.33%
Ranking of countries by current statistics by years