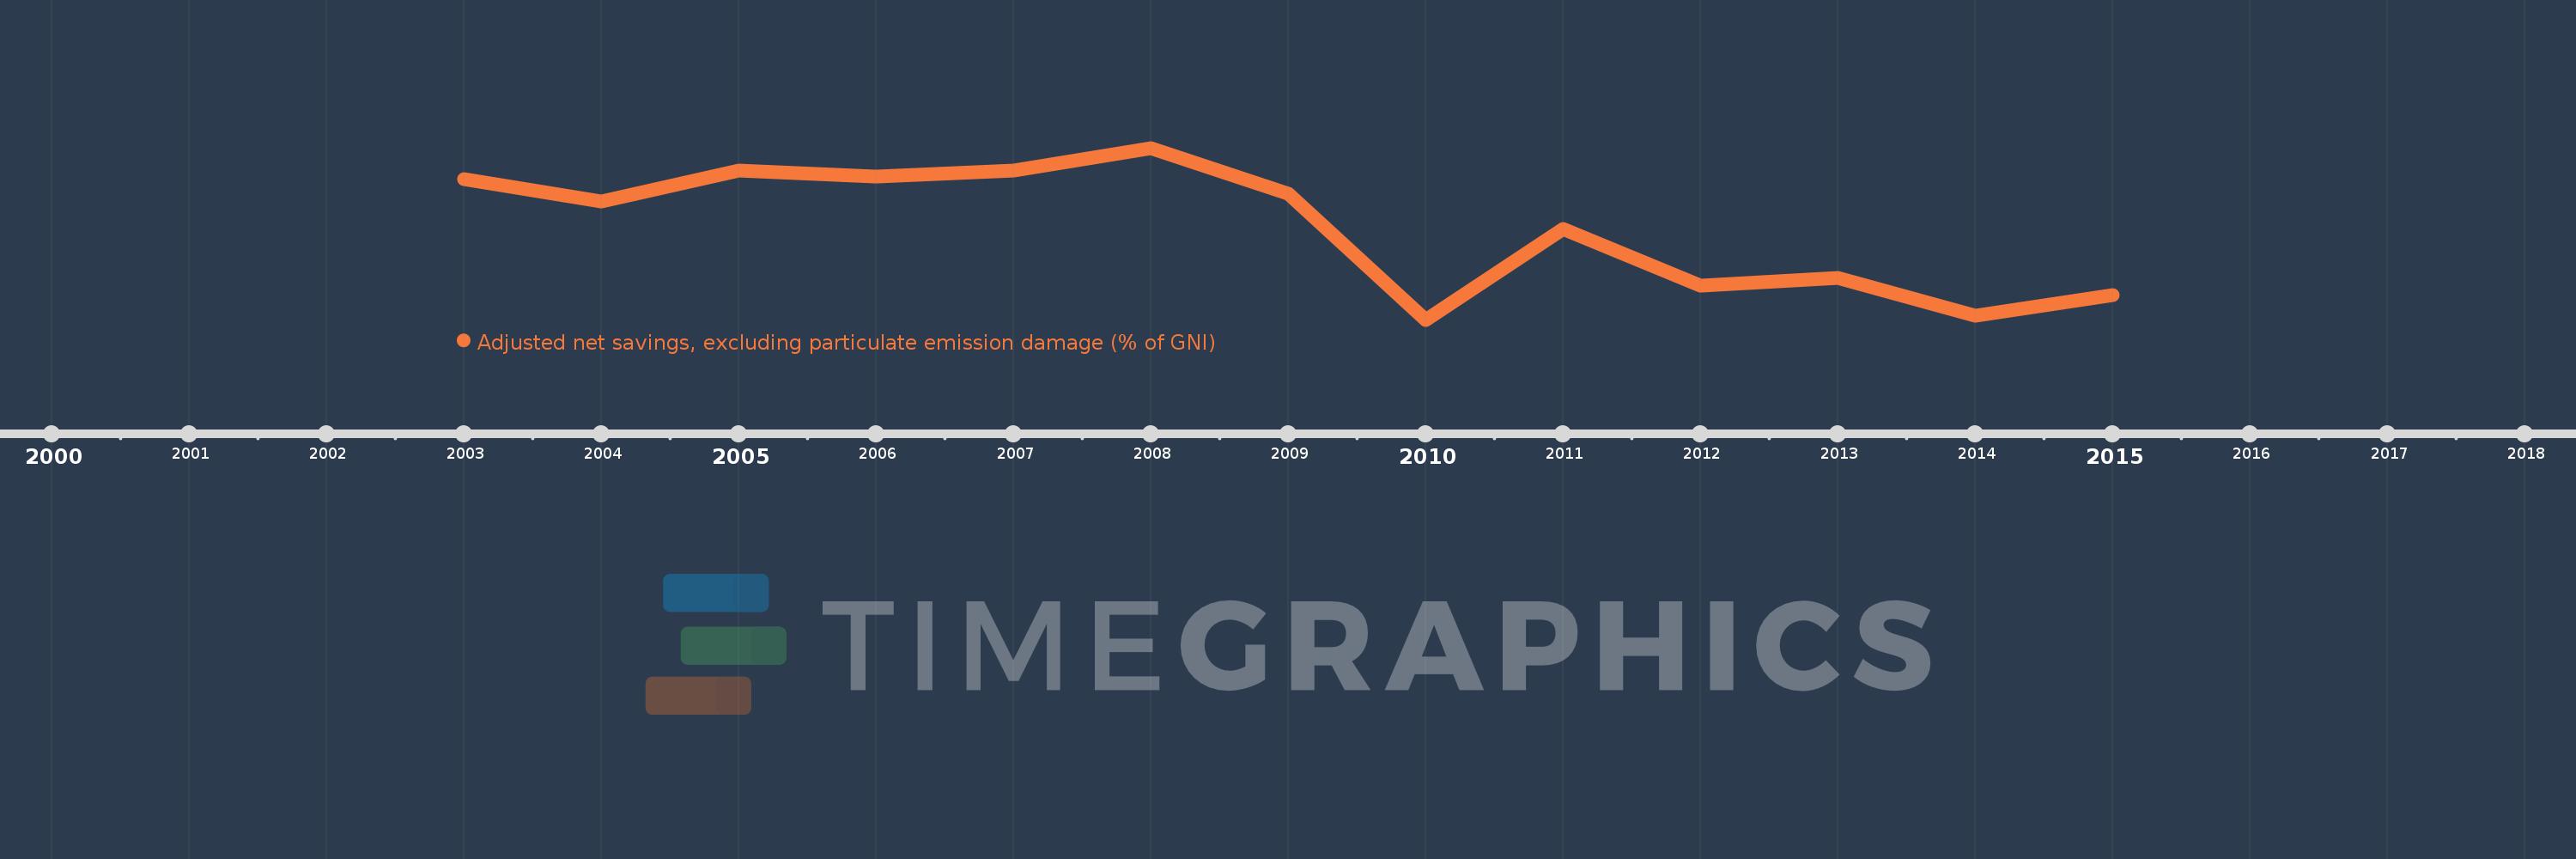
This timeline shows a graph from 2003 to 2015 of Belgium. No data until 2002. Number of actual observations by date: 13.
Source name:
World Development Indicators
Source organization:
World Bank staff estimates based on sources and methods in World Bank's "The Changing Wealth of Nations: Measuring Sustainable Development in the New Millennium" (2011).
Categories, topics:
Economy & Growth, Environment
Last updated:
apr 23, 2017
Indicators value changes by year
Meaning:
12.531
Minimum:
9.073
jan 1, 2010
Maximum:
15.543
jan 1, 2008
At the date of observation
Value
Absolute change
Change from the previous value
jan 1, 2003
14.372
+14.372
0.0%
jan 1, 2004
13.519
-0.853
-5.94%
jan 1, 2005
14.7
+1.182
8.74%
jan 1, 2006
14.479
-0.221
-1.5%
jan 1, 2007
14.688
+0.208
1.44%
jan 1, 2008
15.543
+0.855
5.82%
jan 1, 2009
13.829
-1.714
-11.03%
jan 1, 2010
9.073
-4.756
-34.39%
jan 1, 2011
12.497
+3.424
37.74%
jan 1, 2012
10.343
-2.155
-17.24%
jan 1, 2013
10.649
+0.307
2.97%
jan 1, 2014
9.225
-1.424
-13.37%
jan 1, 2015
9.99
+0.764
8.28%
Ranking of countries by current statistics by years