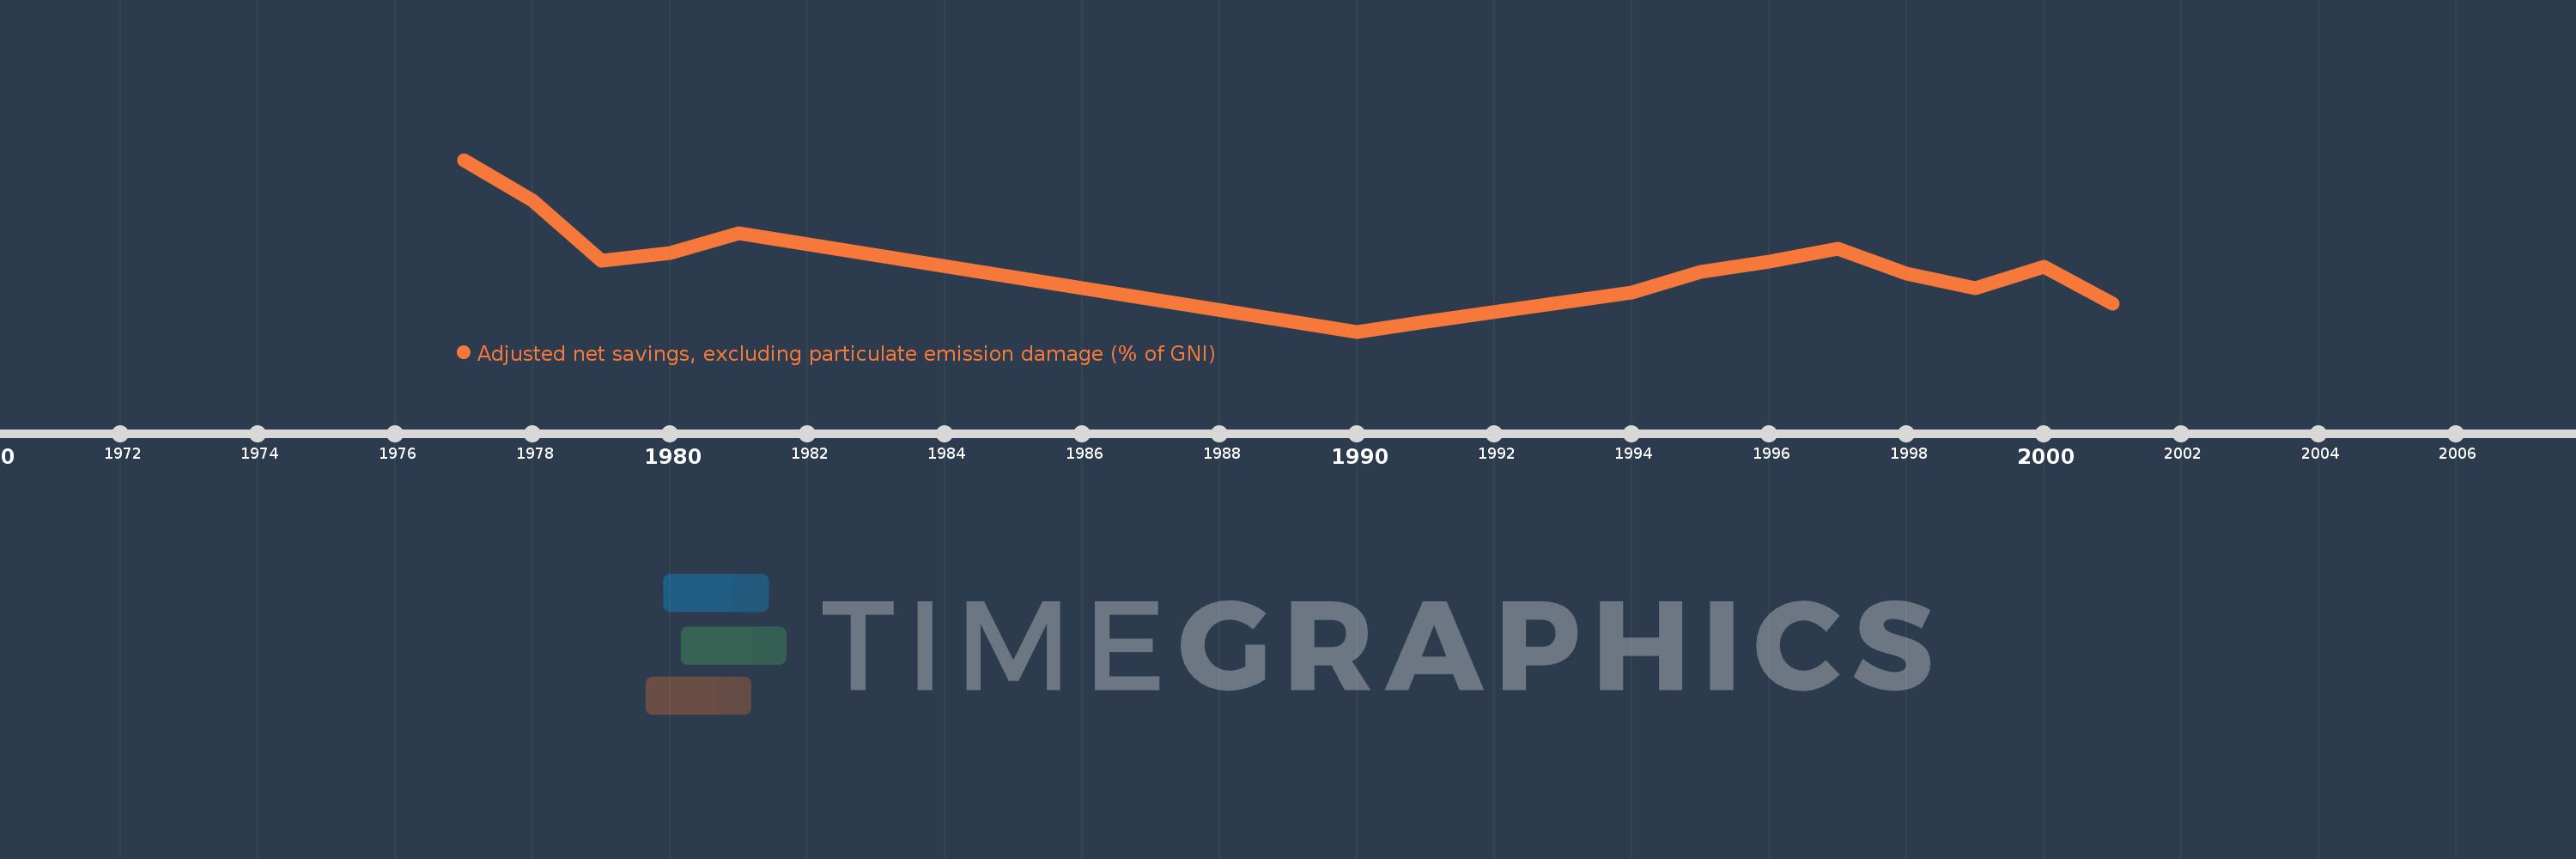
This timeline shows a graph from 1977 to 2001 of Iran, Islamic Rep.. No data until 1976. Number of actual observations by date: 15.
Source name:
World Development Indicators
Source organization:
World Bank staff estimates based on sources and methods in World Bank's "The Changing Wealth of Nations: Measuring Sustainable Development in the New Millennium" (2011).
Categories, topics:
Economy & Growth, Environment
Last updated:
apr 23, 2017
Indicators value changes by year
Meaning:
15.458
Minimum:
3.14
jan 1, 1990
Maximum:
34.75
jan 1, 1977
At the date of observation
Value
Absolute change
Change from the previous value
jan 1, 1977
34.75
+34.75
0.0%
jan 1, 1978
27.2
-7.55
-21.73%
jan 1, 1979
16.202
-10.999
-40.44%
jan 1, 1980
17.611
+1.41
8.7%
jan 1, 1981
21.224
+3.613
20.51%
jan 1, 1990
3.14
-18.084
-85.21%
jan 1, 1991
4.923
+1.784
56.8%
jan 1, 1994
10.283
+5.36
108.86%
jan 1, 1995
14.063
+3.779
36.75%
jan 1, 1996
15.99
+1.927
13.7%
jan 1, 1997
18.324
+2.334
14.6%
jan 1, 1998
13.823
-4.501
-24.56%
jan 1, 1999
11.098
-2.725
-19.72%
jan 1, 2000
15.01
+3.913
35.26%
jan 1, 2001
8.229
-6.781
-45.18%
Ranking of countries by current statistics by years