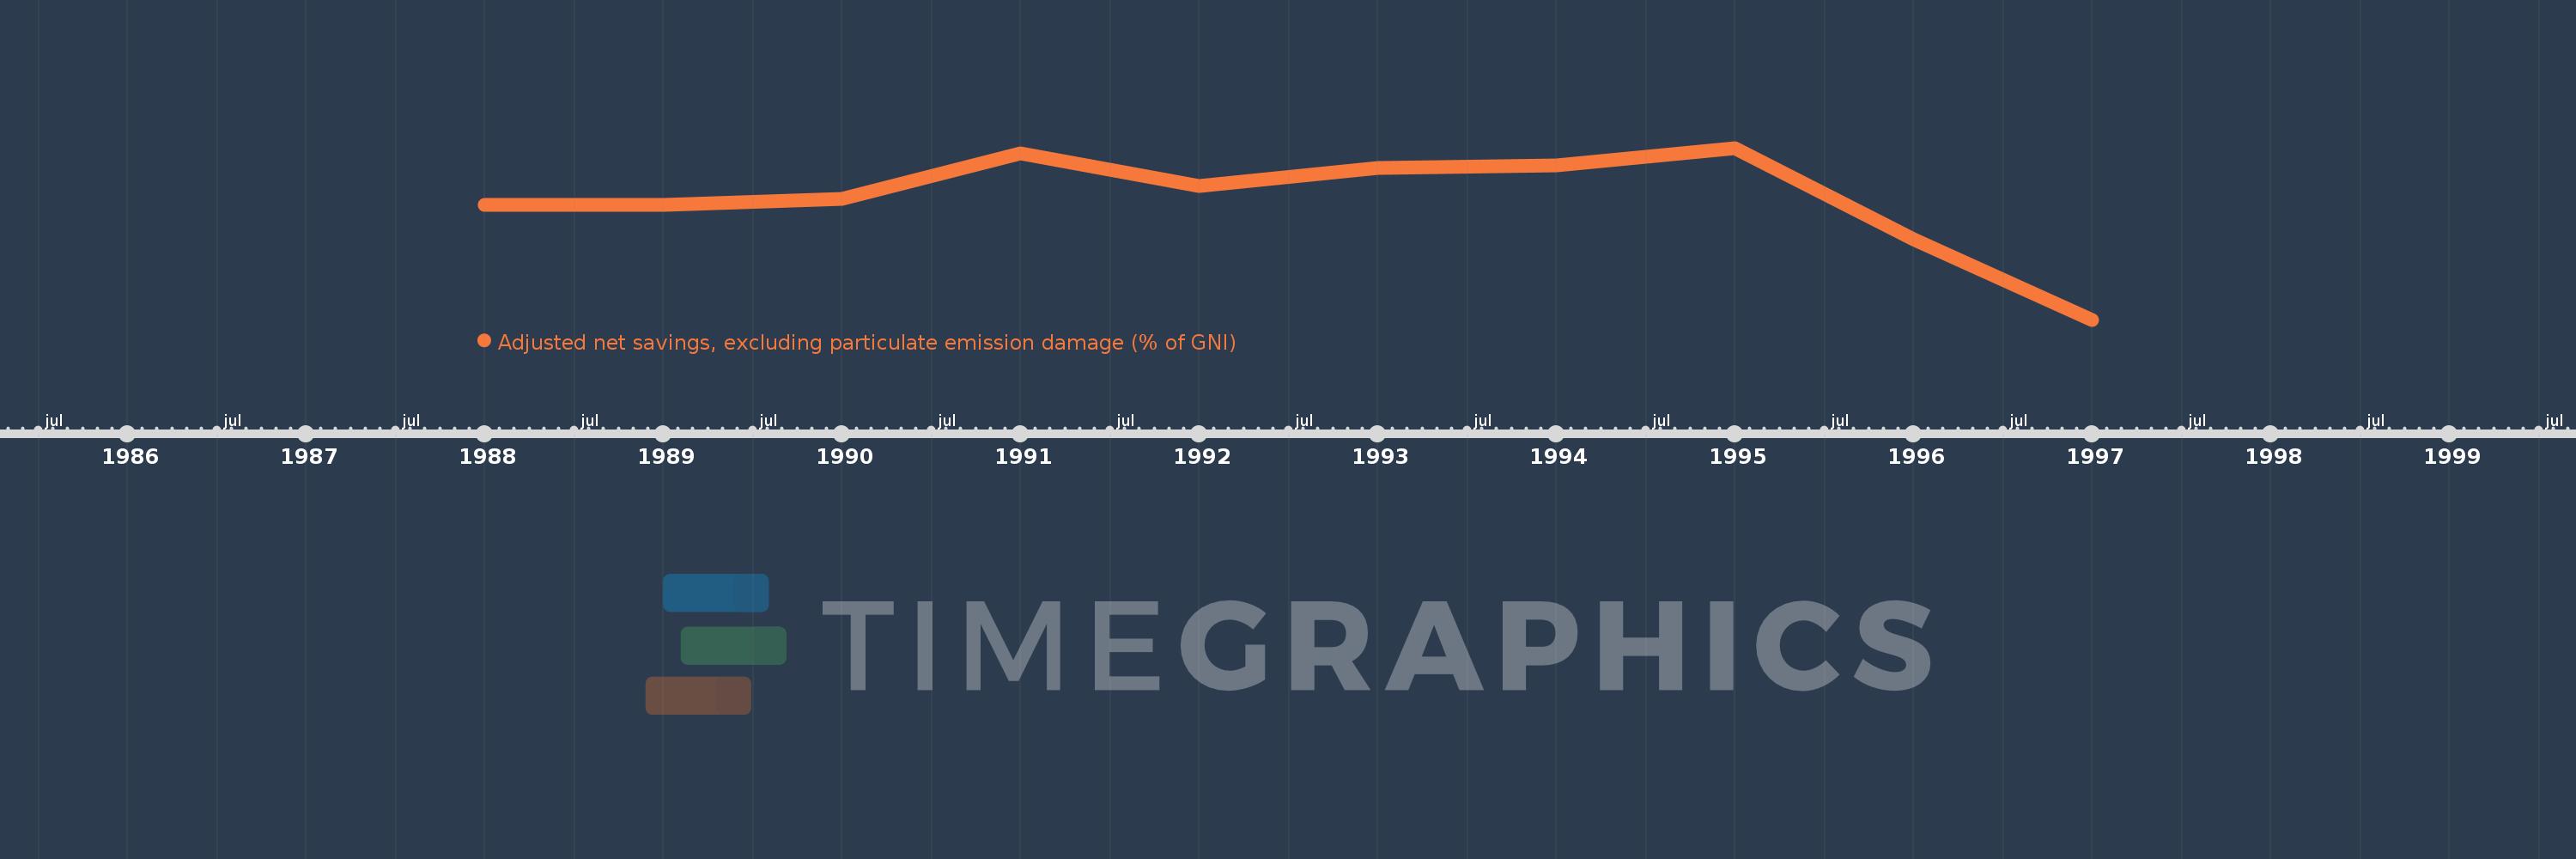
This timeline shows a graph from 1988 to 1997 of Equatorial Guinea. No data until 1987. Number of actual observations by date: 10.
Source name:
World Development Indicators
Source organization:
World Bank staff estimates based on sources and methods in World Bank's "The Changing Wealth of Nations: Measuring Sustainable Development in the New Millennium" (2011).
Categories, topics:
Economy & Growth, Environment
Last updated:
apr 23, 2017
Indicators value changes by year
Meaning:
-42.532
Minimum:
-237.053
jan 1, 1997
Maximum:
39.284
jan 1, 1995
At the date of observation
Value
Absolute change
Change from the previous value
jan 1, 1988
-51.929
-51.929
0.0%
jan 1, 1989
-52.021
-0.091
0.18%
jan 1, 1990
-42.272
+9.749
-18.74%
jan 1, 1991
31.212
+73.484
-173.83%
jan 1, 1992
-22.307
-53.519
-171.47%
jan 1, 1993
6.962
+29.269
-131.21%
jan 1, 1994
10.72
+3.758
53.98%
jan 1, 1995
39.284
+28.564
266.46%
jan 1, 1996
-107.914
-147.197
-374.7%
jan 1, 1997
-237.053
-129.139
119.67%
Ranking of countries by current statistics by years