33
/
AIzaSyB4mHJ5NPEv-XzF7P6NDYXjlkCWaeKw5bc
November 30, 2025
70290
Argentina
ARG
true
2
1
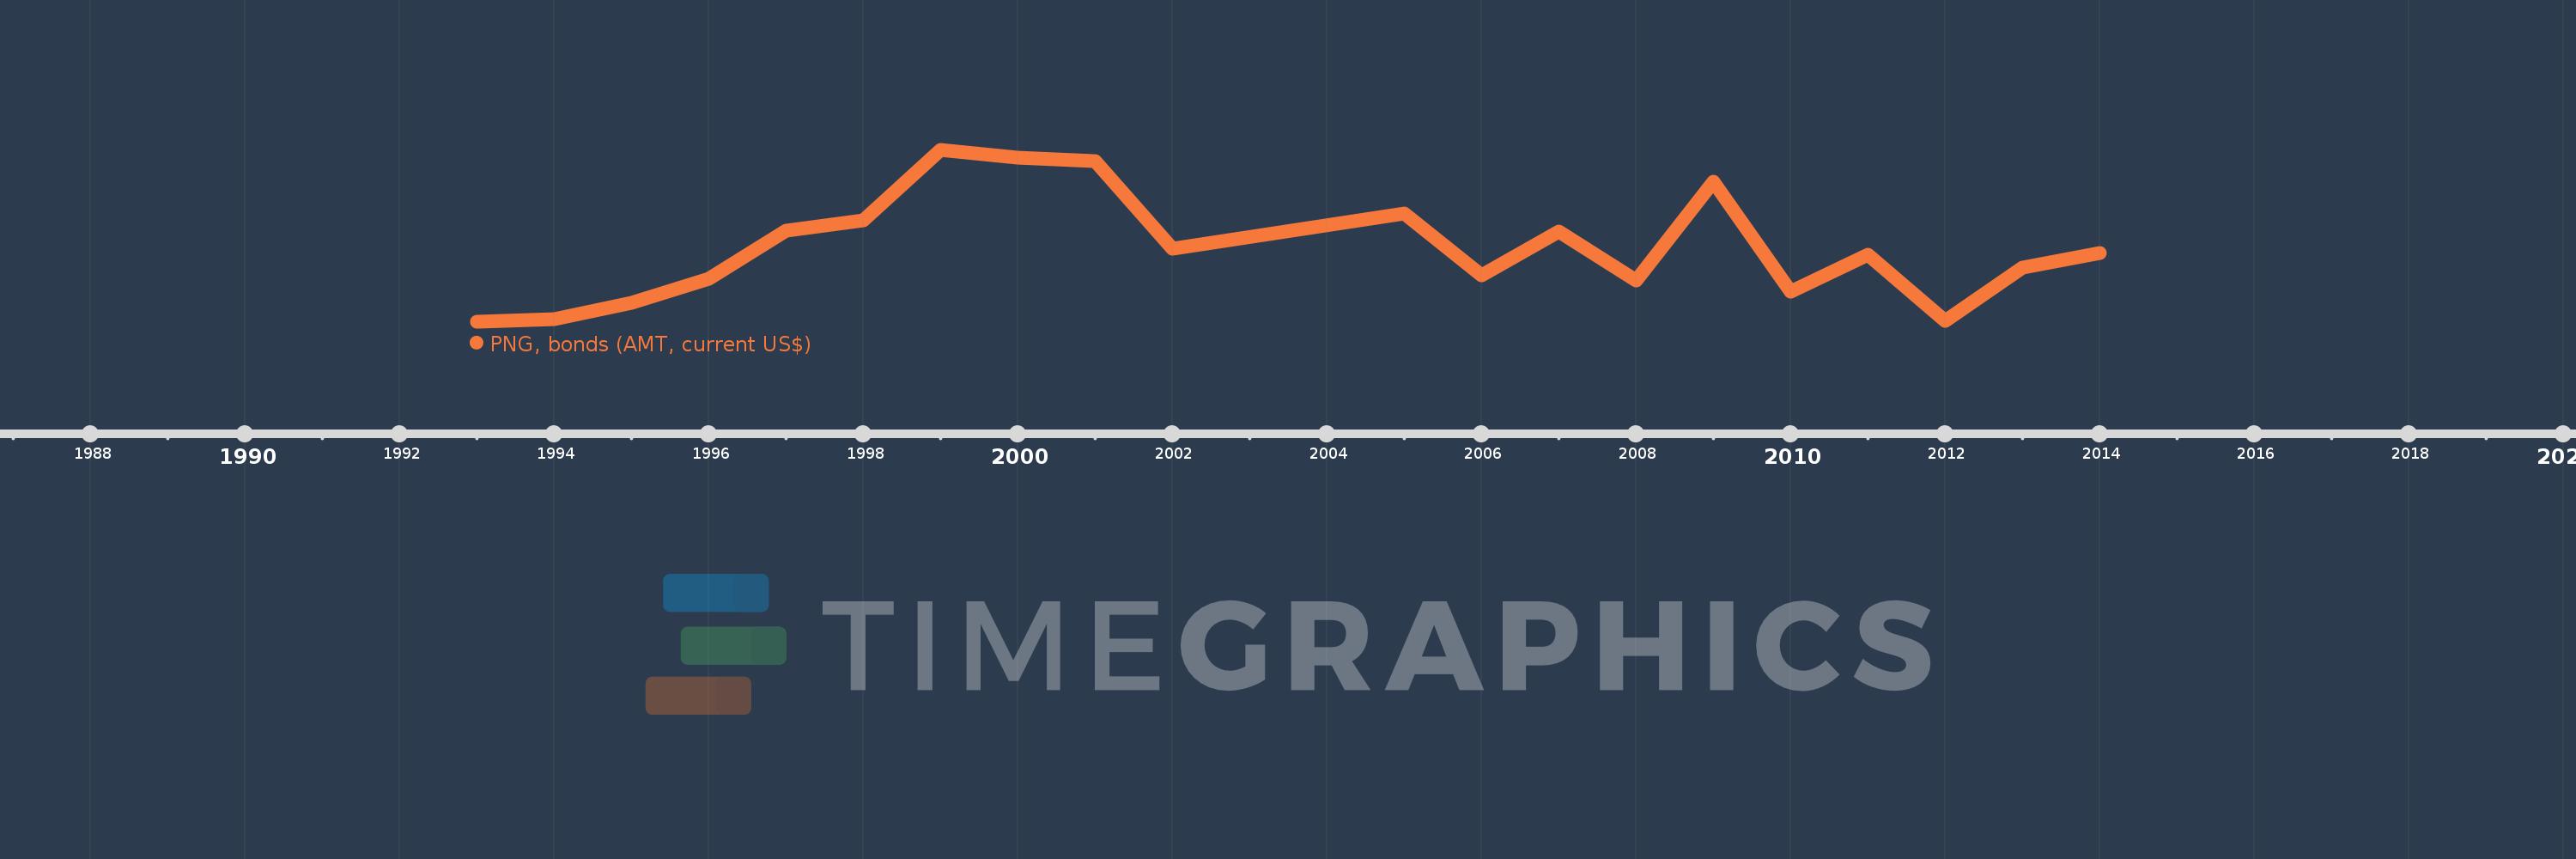
PNG, bonds (AMT, current US$)
2014,2013,2012,2011,2010,2009,2008,2007,2006,2005,2002,2001,2000,1999,1998,1997,1996,1995,1994,1993
Create a timeline
Public Timelines
For education
For educational institutions
For teachers
For students
Cabinet
For educational institutions
For teachers
For students
Open cabinet
FAQ
Close
Create a timeline
Public timelines
FAQ
About & Feedback
Terms
Privacy
FAQ
Support 24/7
Cabinet
Get premium
Donate
Download
Global statistics library
→
Argentina
→
PNG, bonds (AMT, current US$)
This statistics in other country:
Argentina
Botswana
Brazil
Bulgaria
China
Colombia
Dominican Republic
East Asia & Pacific (excluding high income)
Ecuador
Egypt, Arab Rep.
Europe & Central Asia (excluding high income)
Ghana
Guatemala
IDA only
India
Indonesia
Jamaica
Kazakhstan
Latin America & Caribbean (excluding high income)
Lebanon
Low & middle income
Lower middle income
Malaysia
Mexico
Middle East & North Africa (excluding high income)
Middle income
Mongolia
Pakistan
Panama
Peru
Philippines
Romania
Russian Federation
Serbia
South Africa
South Asia
Sri Lanka
Sub-Saharan Africa (excluding high income)
Thailand
Turkey
Ukraine
Upper middle income
Venezuela, RB
Timeline:
This timeline shows a graph from
1993
to
2014
of Argentina. No data until
1992
. Number of actual observations by date:
20
.
Source name:
World Development Indicators
Source organization:
World Bank, International Debt Statistics.
Categories, topics:
External Debt
Last updated:
apr 23, 2017
Indicators value changes by year
Meaning:
1.067 bln
Minimum:
15.0 mln
jan 1, 1993
Maximum:
2.462 bln
jan 1, 1999
At the date of observation
Value
Absolute change
Change from the previous value
jan 1, 1993
15.0 mln
+15.0 mln
0.0%
jan 1, 1994
50.0 mln
+35.0 mln
233.33%
jan 1, 1995
290.0 mln
+240.0 mln
480.0%
jan 1, 1996
631.0 mln
+341.0 mln
117.59%
jan 1, 1997
1.311 bln
+680.294 mln
107.81%
jan 1, 1998
1.468 bln
+156.429 mln
11.93%
jan 1, 1999
2.462 bln
+994.054 mln
67.73%
jan 1, 2000
2.357 bln
-104.693 mln
-4.25%
jan 1, 2001
2.309 bln
-48.063 mln
-2.04%
jan 1, 2002
1.058 bln
-1.251 bln
-54.18%
jan 1, 2005
1.565 bln
+507.477 mln
47.97%
jan 1, 2006
680.0 mln
-885.477 mln
-56.56%
jan 1, 2007
1.303 bln
+622.676 mln
91.57%
jan 1, 2008
606.221 mln
-696.455 mln
-53.46%
jan 1, 2009
2.009 bln
+1.402 bln
231.31%
jan 1, 2010
450.0 mln
-1.558 bln
-77.6%
jan 1, 2011
969.308 mln
+519.308 mln
115.4%
jan 1, 2012
25.596 mln
-943.712 mln
-97.36%
jan 1, 2013
785.0 mln
+759.404 mln
2.97K%
jan 1, 2014
999.027 mln
+214.027 mln
27.26%
Ranking of countries by current statistics by years
About & Feedback
Terms
Privacy
FAQ
Support 24/7
Cabinet
Get premium
Donate
The service accepts bank transfer (ACH, Wire) or cards (Visa, MasterCard, etc). Processed by Stripe.
Secured with SSL