Download This statistics in other country:
Timeline:
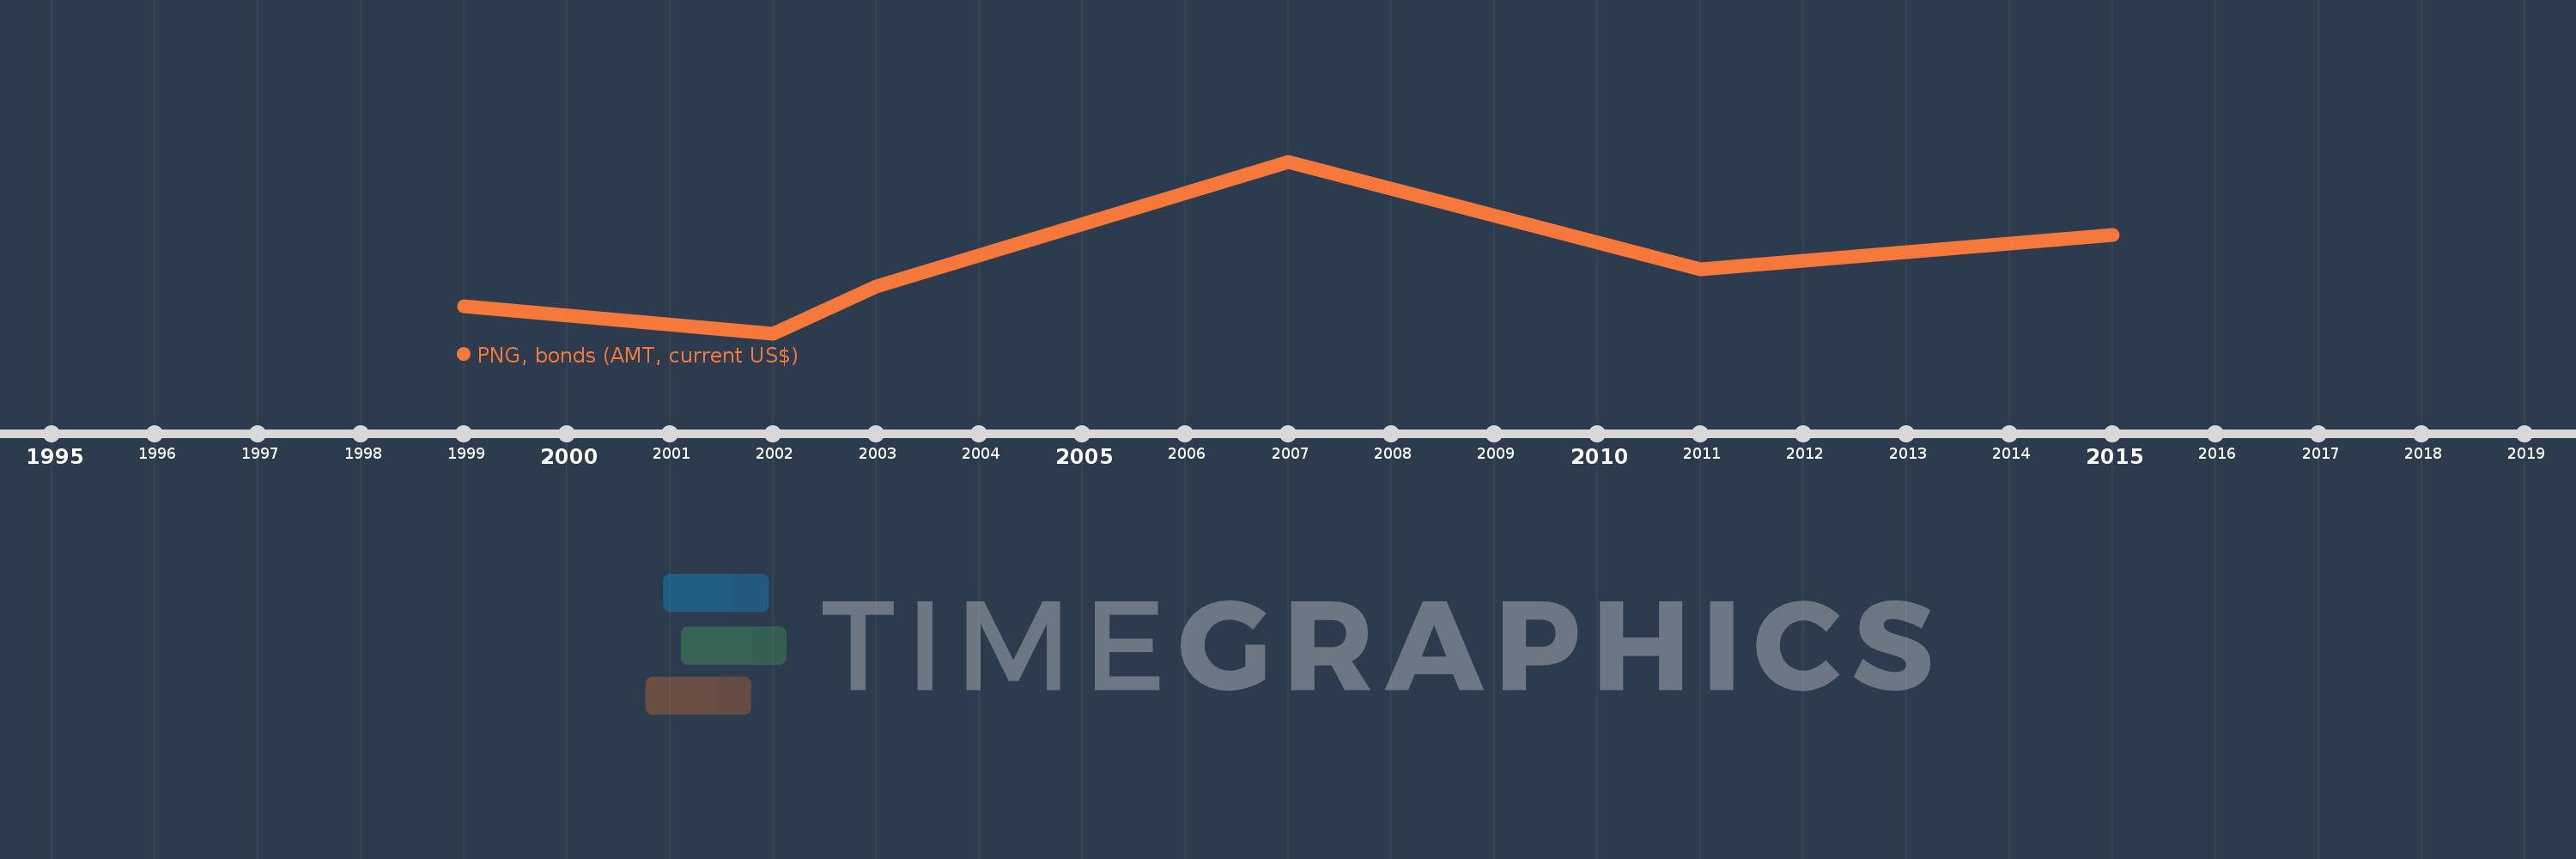
This timeline shows a graph from 1999 to 2015 of Panama. No data until 1998. Number of actual observations by date: 6.
Source name:
World Development Indicators
Source organization:
World Bank, International Debt Statistics.
Categories, topics:
External Debt
Last updated:
apr 23, 2017
Indicators value changes by year
Minimum:
20.0 mln
jan 1, 2002
Maximum:
369.078 mln
jan 1, 2007
At the date of observation
Value
Absolute change
Change from the previous value
jan 1, 1999
75.0 mln
+75.0 mln
0.0%
jan 1, 2002
20.0 mln
-55.0 mln
-73.33%
jan 1, 2003
115.0 mln
+95.0 mln
475.0%
jan 1, 2007
369.078 mln
+254.078 mln
220.94%
jan 1, 2011
150.0 mln
-219.078 mln
-59.36%
jan 1, 2015
220.0 mln
+70.0 mln
46.67%
Ranking of countries by current statistics by years