33
/
AIzaSyB4mHJ5NPEv-XzF7P6NDYXjlkCWaeKw5bc
November 30, 2025
262751
Thailand
THA
true
2
1
PNG, bonds (AMT, current US$)
2016,2015,2014,2013,2012,2011,2010,2009,2008,2007,2006,2005,2004,2003,2002,2001,2000,1999,1998,1997
Create a timeline
Public Timelines
For education
For educational institutions
For teachers
For students
Cabinet
For educational institutions
For teachers
For students
Open cabinet
FAQ
Close
Create a timeline
Public timelines
FAQ
About & Feedback
Terms
Privacy
FAQ
Support 24/7
Cabinet
Get premium
Donate
Download
Global statistics library
→
Thailand
→
PNG, bonds (AMT, current US$)
This statistics in other country:
Argentina
Botswana
Brazil
Bulgaria
China
Colombia
Dominican Republic
East Asia & Pacific (excluding high income)
Ecuador
Egypt, Arab Rep.
Europe & Central Asia (excluding high income)
Ghana
Guatemala
IDA only
India
Indonesia
Jamaica
Kazakhstan
Latin America & Caribbean (excluding high income)
Lebanon
Low & middle income
Lower middle income
Malaysia
Mexico
Middle East & North Africa (excluding high income)
Middle income
Mongolia
Pakistan
Panama
Peru
Philippines
Romania
Russian Federation
Serbia
South Africa
South Asia
Sri Lanka
Sub-Saharan Africa (excluding high income)
Thailand
Turkey
Ukraine
Upper middle income
Venezuela, RB
Timeline:
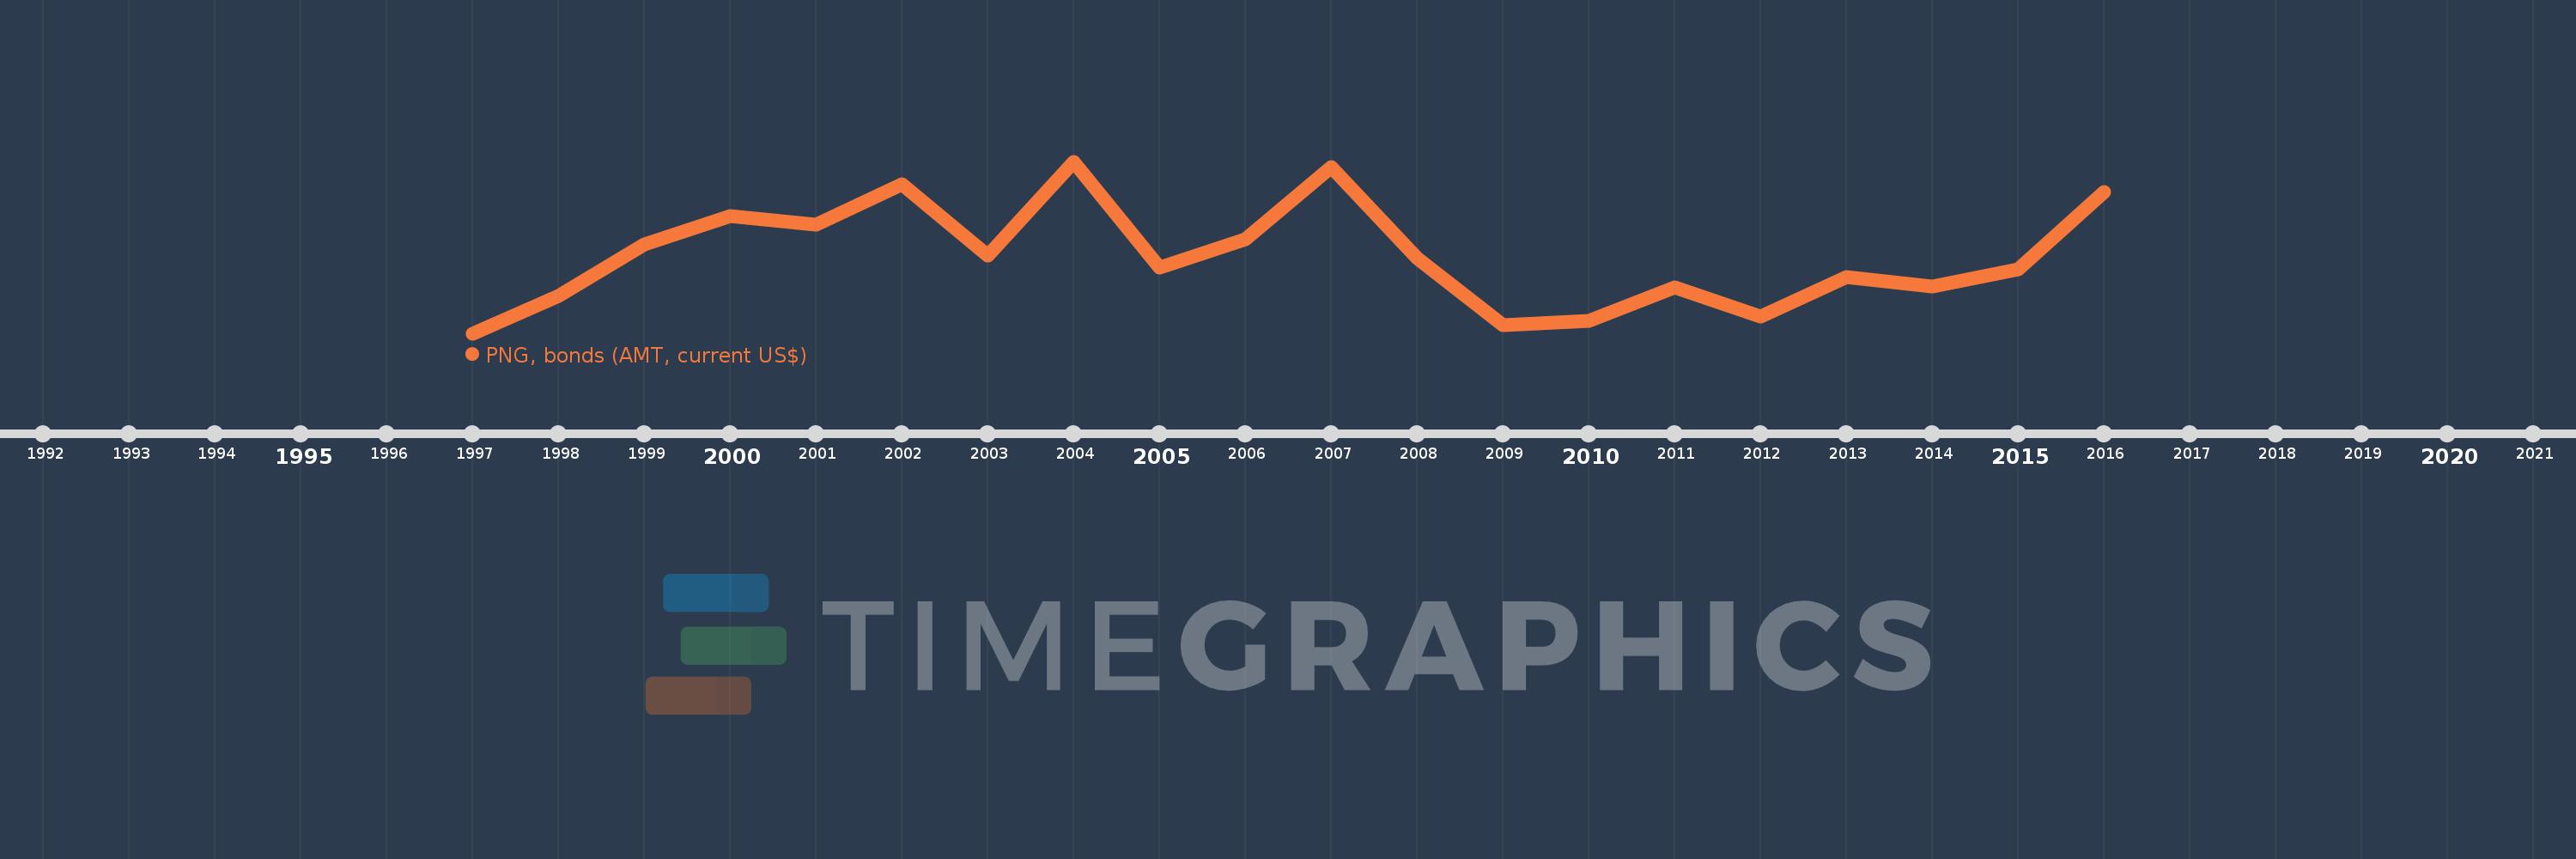
This timeline shows a graph from
1997
to
2016
of Thailand. No data until
1996
. Number of actual observations by date:
20
.
Source name:
World Development Indicators
Source organization:
World Bank, International Debt Statistics.
Categories, topics:
External Debt
Last updated:
apr 23, 2017
Indicators value changes by year
Meaning:
749.027 mln
Minimum:
25.0 mln
jan 1, 1997
Maximum:
1.637 bln
jan 1, 2004
At the date of observation
Value
Absolute change
Change from the previous value
jan 1, 1997
25.0 mln
+25.0 mln
0.0%
jan 1, 1998
373.362 mln
+348.362 mln
1.39K%
jan 1, 1999
859.411 mln
+486.049 mln
130.18%
jan 1, 2000
1.125 bln
+265.55 mln
30.9%
jan 1, 2001
1.044 bln
-80.836 mln
-7.19%
jan 1, 2002
1.426 bln
+382.087 mln
36.59%
jan 1, 2003
757.87 mln
-668.342 mln
-46.86%
jan 1, 2004
1.637 bln
+878.734 mln
115.95%
jan 1, 2005
640.0 mln
-996.604 mln
-60.89%
jan 1, 2006
908.0 mln
+268.0 mln
41.87%
jan 1, 2007
1.585 bln
+677.0 mln
74.56%
jan 1, 2008
729.499 mln
-855.501 mln
-53.97%
jan 1, 2009
100.0 mln
-629.499 mln
-86.29%
jan 1, 2010
141.0 mln
+41.0 mln
41.0%
jan 1, 2011
459.504 mln
+318.504 mln
225.89%
jan 1, 2012
180.0 mln
-279.504 mln
-60.83%
jan 1, 2013
550.0 mln
+370.0 mln
205.56%
jan 1, 2014
465.0 mln
-85.0 mln
-15.45%
jan 1, 2015
625.0 mln
+160.0 mln
34.41%
jan 1, 2016
1.35 bln
+725.0 mln
116.0%
Ranking of countries by current statistics by years
About & Feedback
Terms
Privacy
FAQ
Support 24/7
Cabinet
Get premium
Donate
The service accepts bank transfer (ACH, Wire) or cards (Visa, MasterCard, etc). Processed by Stripe.
Secured with SSL