Download This statistics in other country:
Timeline:
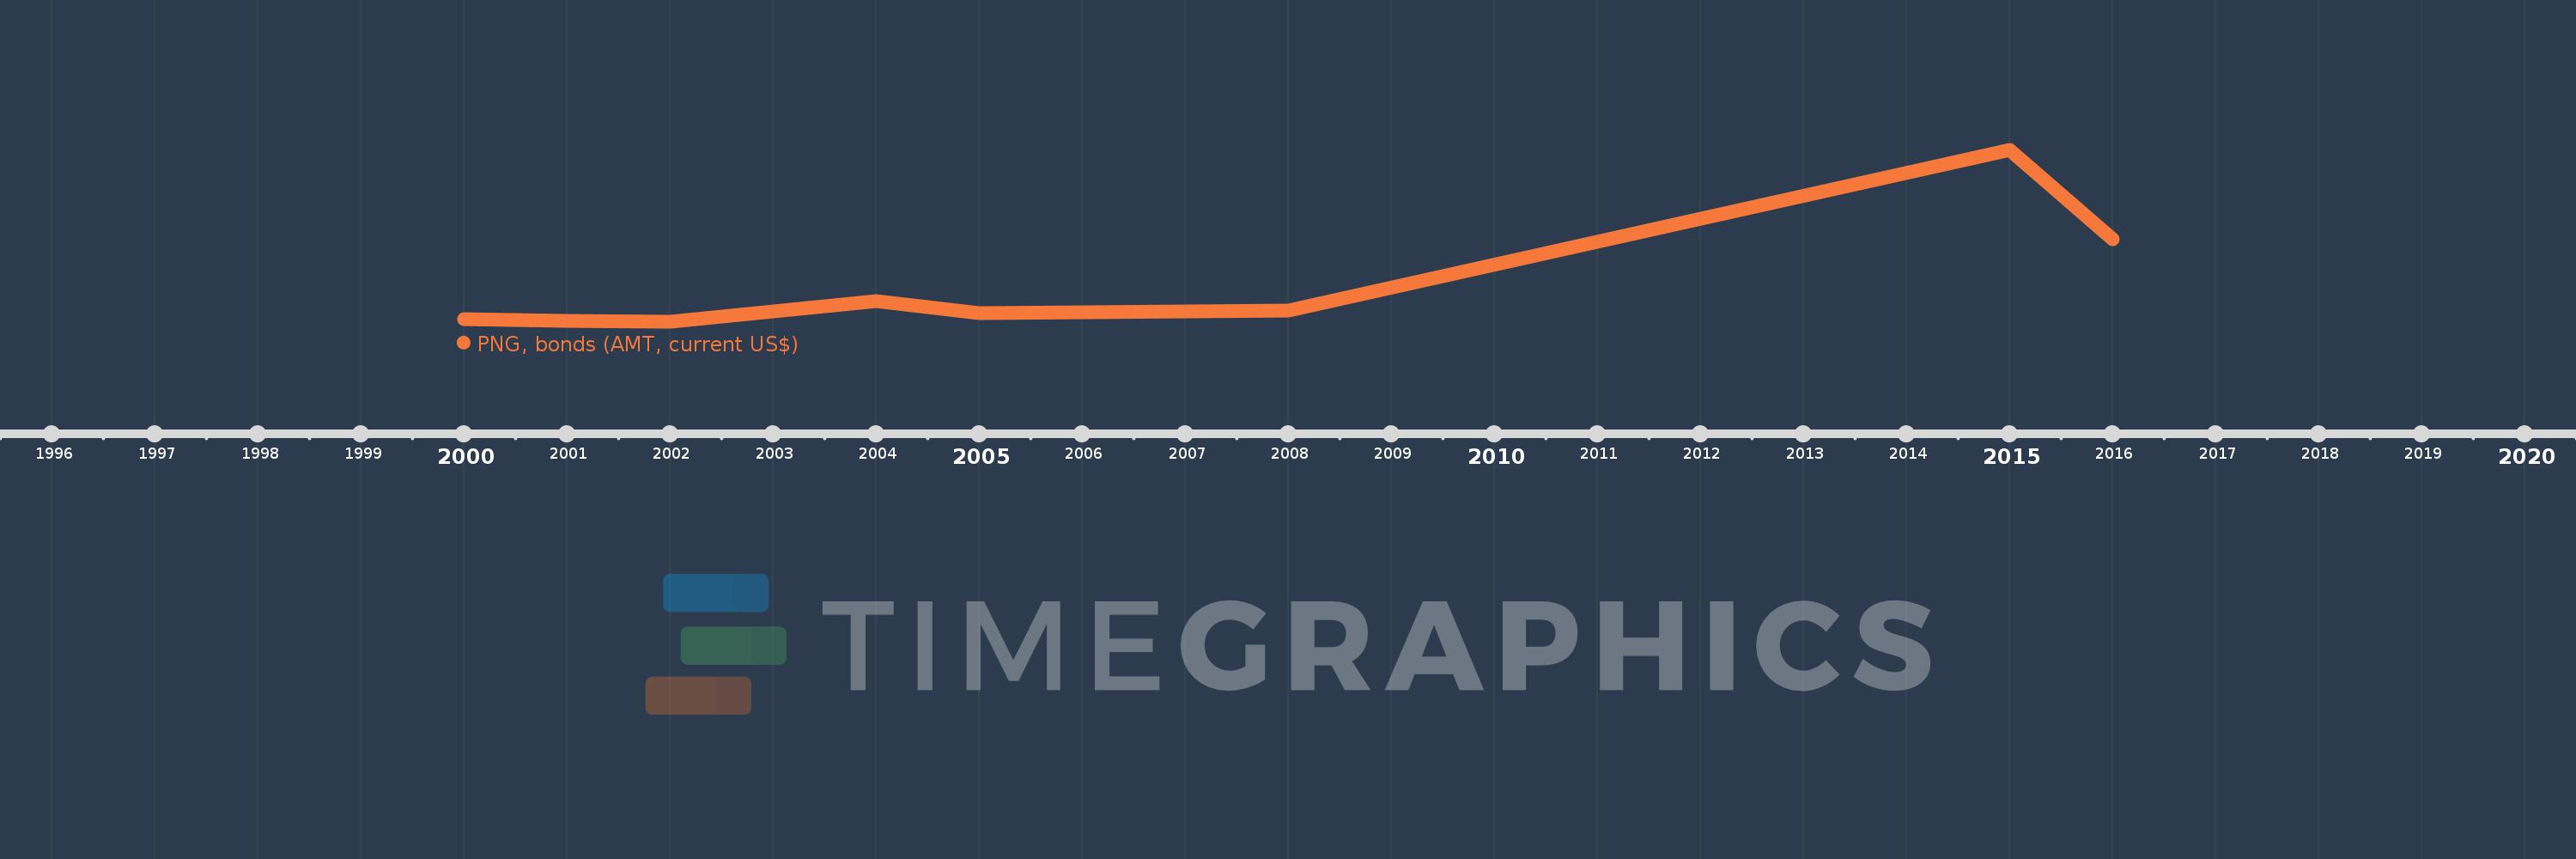
This timeline shows a graph from 2000 to 2016 of Colombia. No data until 1999. Number of actual observations by date: 8.
Source name:
World Development Indicators
Source organization:
World Bank, International Debt Statistics.
Categories, topics:
External Debt
Last updated:
apr 23, 2017
Indicators value changes by year
Minimum:
98.26 mln
jan 1, 2002
Maximum:
1.6 bln
jan 1, 2015
At the date of observation
Value
Absolute change
Change from the previous value
jan 1, 2000
125.0 mln
+125.0 mln
0.0%
jan 1, 2001
110.0 mln
-15.0 mln
-12.0%
jan 1, 2002
98.26 mln
-11.74 mln
-10.67%
jan 1, 2004
281.93 mln
+183.67 mln
186.92%
jan 1, 2005
175.6 mln
-106.33 mln
-37.72%
jan 1, 2008
200.0 mln
+24.4 mln
13.9%
jan 1, 2015
1.6 bln
+1.4 bln
700.0%
jan 1, 2016
820.0 mln
-780.0 mln
-48.75%
Ranking of countries by current statistics by years