33
/
AIzaSyB4mHJ5NPEv-XzF7P6NDYXjlkCWaeKw5bc
November 30, 2025
196047
Mexico
MEX
true
2
1
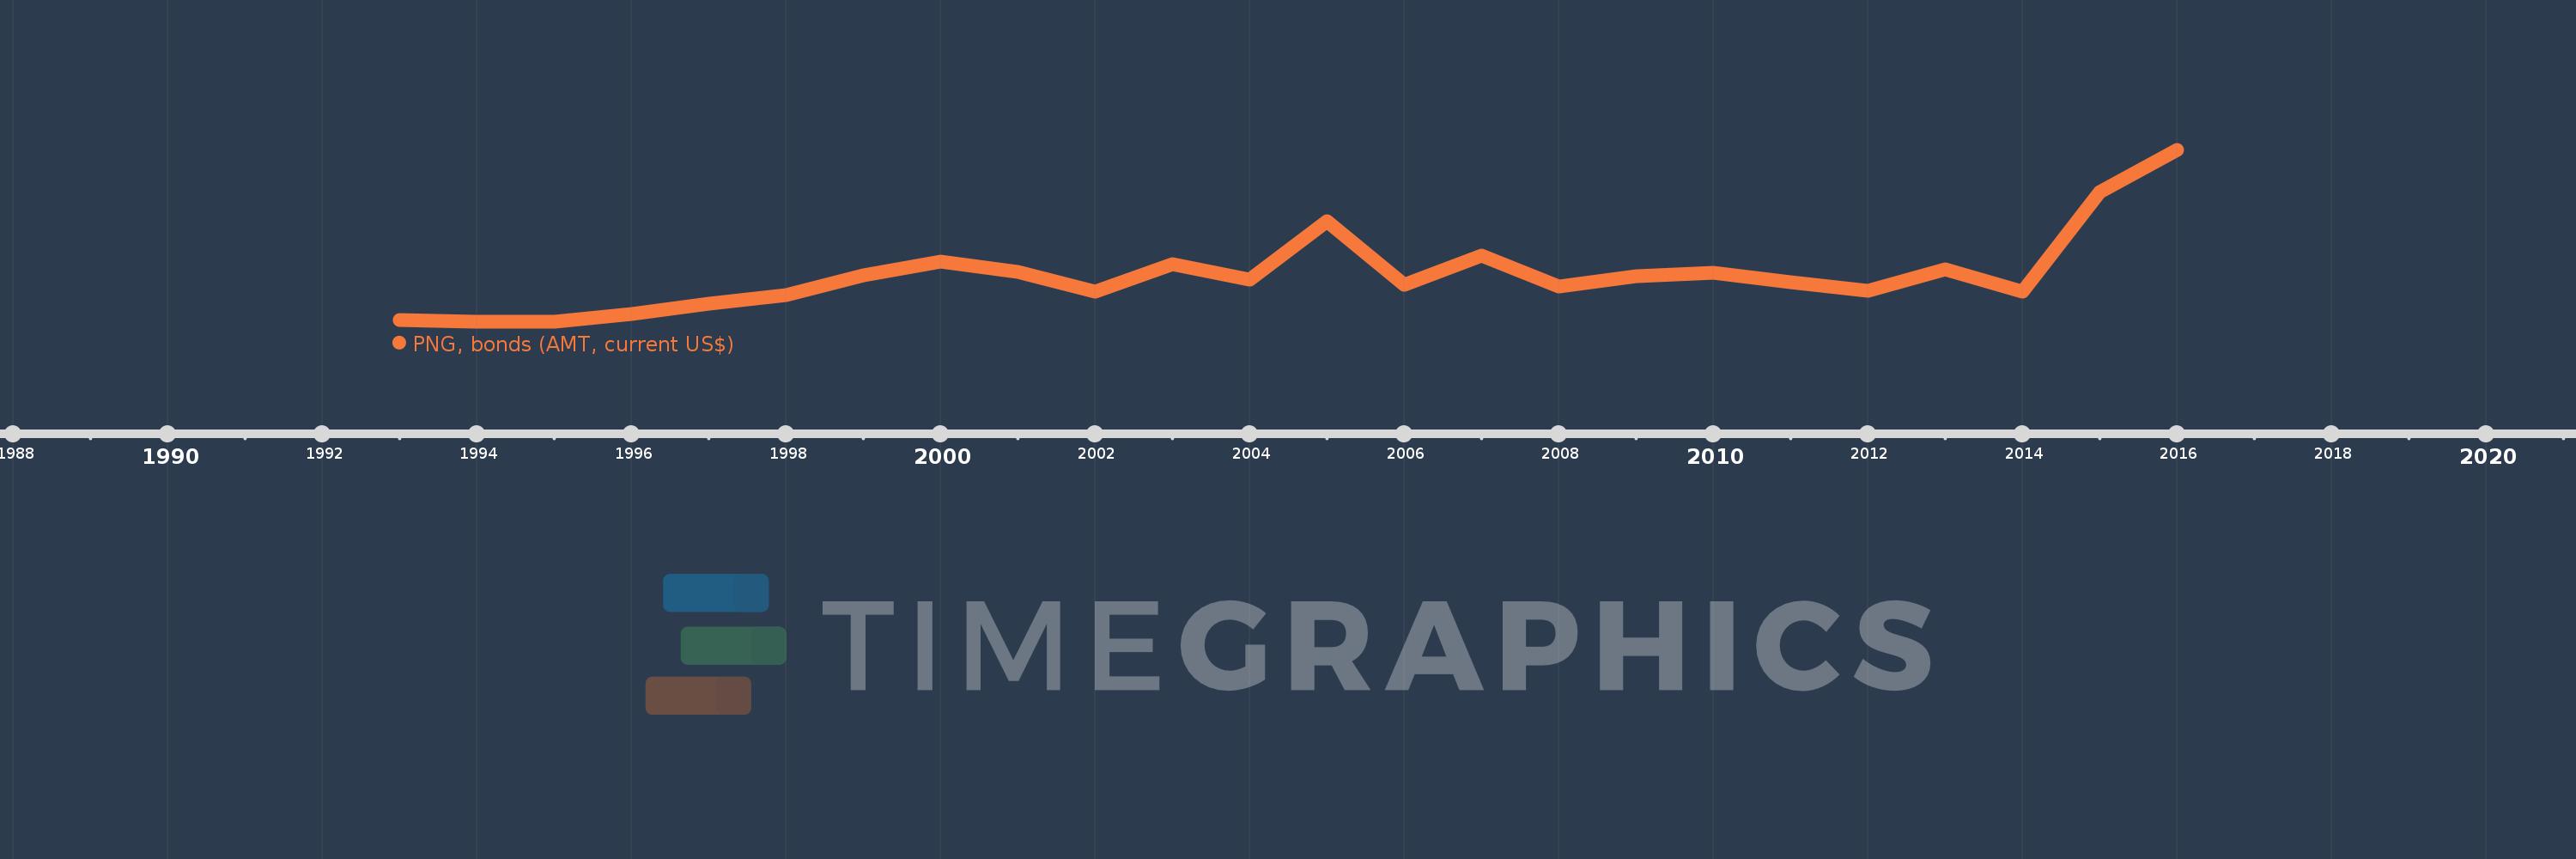
PNG, bonds (AMT, current US$)
2016,2015,2014,2013,2012,2011,2010,2009,2008,2007,2006,2005,2004,2003,2002,2001,2000,1999,1998,1997,1996,1995,1994,1993
Create a timeline
Public Timelines
For education
For educational institutions
For teachers
For students
Cabinet
For educational institutions
For teachers
For students
Open cabinet
FAQ
Close
Create a timeline
Public timelines
FAQ
About & Feedback
Terms
Privacy
FAQ
Support 24/7
Cabinet
Get premium
Donate
Download
Global statistics library
→
Mexico
→
PNG, bonds (AMT, current US$)
This statistics in other country:
Argentina
Botswana
Brazil
Bulgaria
China
Colombia
Dominican Republic
East Asia & Pacific (excluding high income)
Ecuador
Egypt, Arab Rep.
Europe & Central Asia (excluding high income)
Ghana
Guatemala
IDA only
India
Indonesia
Jamaica
Kazakhstan
Latin America & Caribbean (excluding high income)
Lebanon
Low & middle income
Lower middle income
Malaysia
Mexico
Middle East & North Africa (excluding high income)
Middle income
Mongolia
Pakistan
Panama
Peru
Philippines
Romania
Russian Federation
Serbia
South Africa
South Asia
Sri Lanka
Sub-Saharan Africa (excluding high income)
Thailand
Turkey
Ukraine
Upper middle income
Venezuela, RB
Timeline:
This timeline shows a graph from
1993
to
2016
of Mexico. No data until
1992
. Number of actual observations by date:
24
.
Source name:
World Development Indicators
Source organization:
World Bank, International Debt Statistics.
Categories, topics:
External Debt
Last updated:
apr 23, 2017
Indicators value changes by year
Meaning:
3.352 bln
Minimum:
25.0 mln
jan 1, 1994
Maximum:
12.148 bln
jan 1, 2016
At the date of observation
Value
Absolute change
Change from the previous value
jan 1, 1993
150.0 mln
+150.0 mln
0.0%
jan 1, 1994
25.0 mln
-125.0 mln
-83.33%
jan 1, 1995
49.8 mln
+24.8 mln
99.2%
jan 1, 1996
610.0 mln
+560.2 mln
1.12K%
jan 1, 1997
1.328 bln
+717.875 mln
117.68%
jan 1, 1998
1.95 bln
+621.869 mln
46.83%
jan 1, 1999
3.291 bln
+1.341 bln
68.77%
jan 1, 2000
4.264 bln
+973.397 mln
29.58%
jan 1, 2001
3.552 bln
-711.737 mln
-16.69%
jan 1, 2002
2.148 bln
-1.404 bln
-39.53%
jan 1, 2003
4.082 bln
+1.933 bln
90.0%
jan 1, 2004
2.985 bln
-1.096 bln
-26.86%
jan 1, 2005
7.11 bln
+4.125 bln
138.16%
jan 1, 2006
2.645 bln
-4.465 bln
-62.8%
jan 1, 2007
4.703 bln
+2.058 bln
77.81%
jan 1, 2008
2.536 bln
-2.167 bln
-46.08%
jan 1, 2009
3.247 bln
+711.0 mln
28.04%
jan 1, 2010
3.5 bln
+253.0 mln
7.79%
jan 1, 2011
2.826 bln
-674.0 mln
-19.26%
jan 1, 2012
2.216 bln
-610.0 mln
-21.59%
jan 1, 2013
3.723 bln
+1.507 bln
68.01%
jan 1, 2014
2.19 bln
-1.533 bln
-41.18%
jan 1, 2015
9.166 bln
+6.976 bln
318.54%
jan 1, 2016
12.148 bln
+2.982 bln
32.53%
Ranking of countries by current statistics by years
About & Feedback
Terms
Privacy
FAQ
Support 24/7
Cabinet
Get premium
Donate
The service accepts bank transfer (ACH, Wire) or cards (Visa, MasterCard, etc). Processed by Stripe.
Secured with SSL