33
/
AIzaSyB4mHJ5NPEv-XzF7P6NDYXjlkCWaeKw5bc
November 30, 2025
57459
South Asia
SAS
false
2
1
PNG, bonds (AMT, current US$)
2016,2015,2014,2013,2012,2011,2010,2009,2008,2007,2006,2005,2004,2003,2002,2001,2000,1999,1998
Create a timeline
Public Timelines
For education
For educational institutions
For teachers
For students
Cabinet
For educational institutions
For teachers
For students
Open cabinet
FAQ
Close
Create a timeline
Public timelines
FAQ
About & Feedback
Terms
Privacy
FAQ
Support 24/7
Cabinet
Get premium
Donate
Download
Global statistics library
→
South Asia
→
PNG, bonds (AMT, current US$)
This statistics in other country:
Argentina
Botswana
Brazil
Bulgaria
China
Colombia
Dominican Republic
East Asia & Pacific (excluding high income)
Ecuador
Egypt, Arab Rep.
Europe & Central Asia (excluding high income)
Ghana
Guatemala
IDA only
India
Indonesia
Jamaica
Kazakhstan
Latin America & Caribbean (excluding high income)
Lebanon
Low & middle income
Lower middle income
Malaysia
Mexico
Middle East & North Africa (excluding high income)
Middle income
Mongolia
Pakistan
Panama
Peru
Philippines
Romania
Russian Federation
Serbia
South Africa
South Asia
Sri Lanka
Sub-Saharan Africa (excluding high income)
Thailand
Turkey
Ukraine
Upper middle income
Venezuela, RB
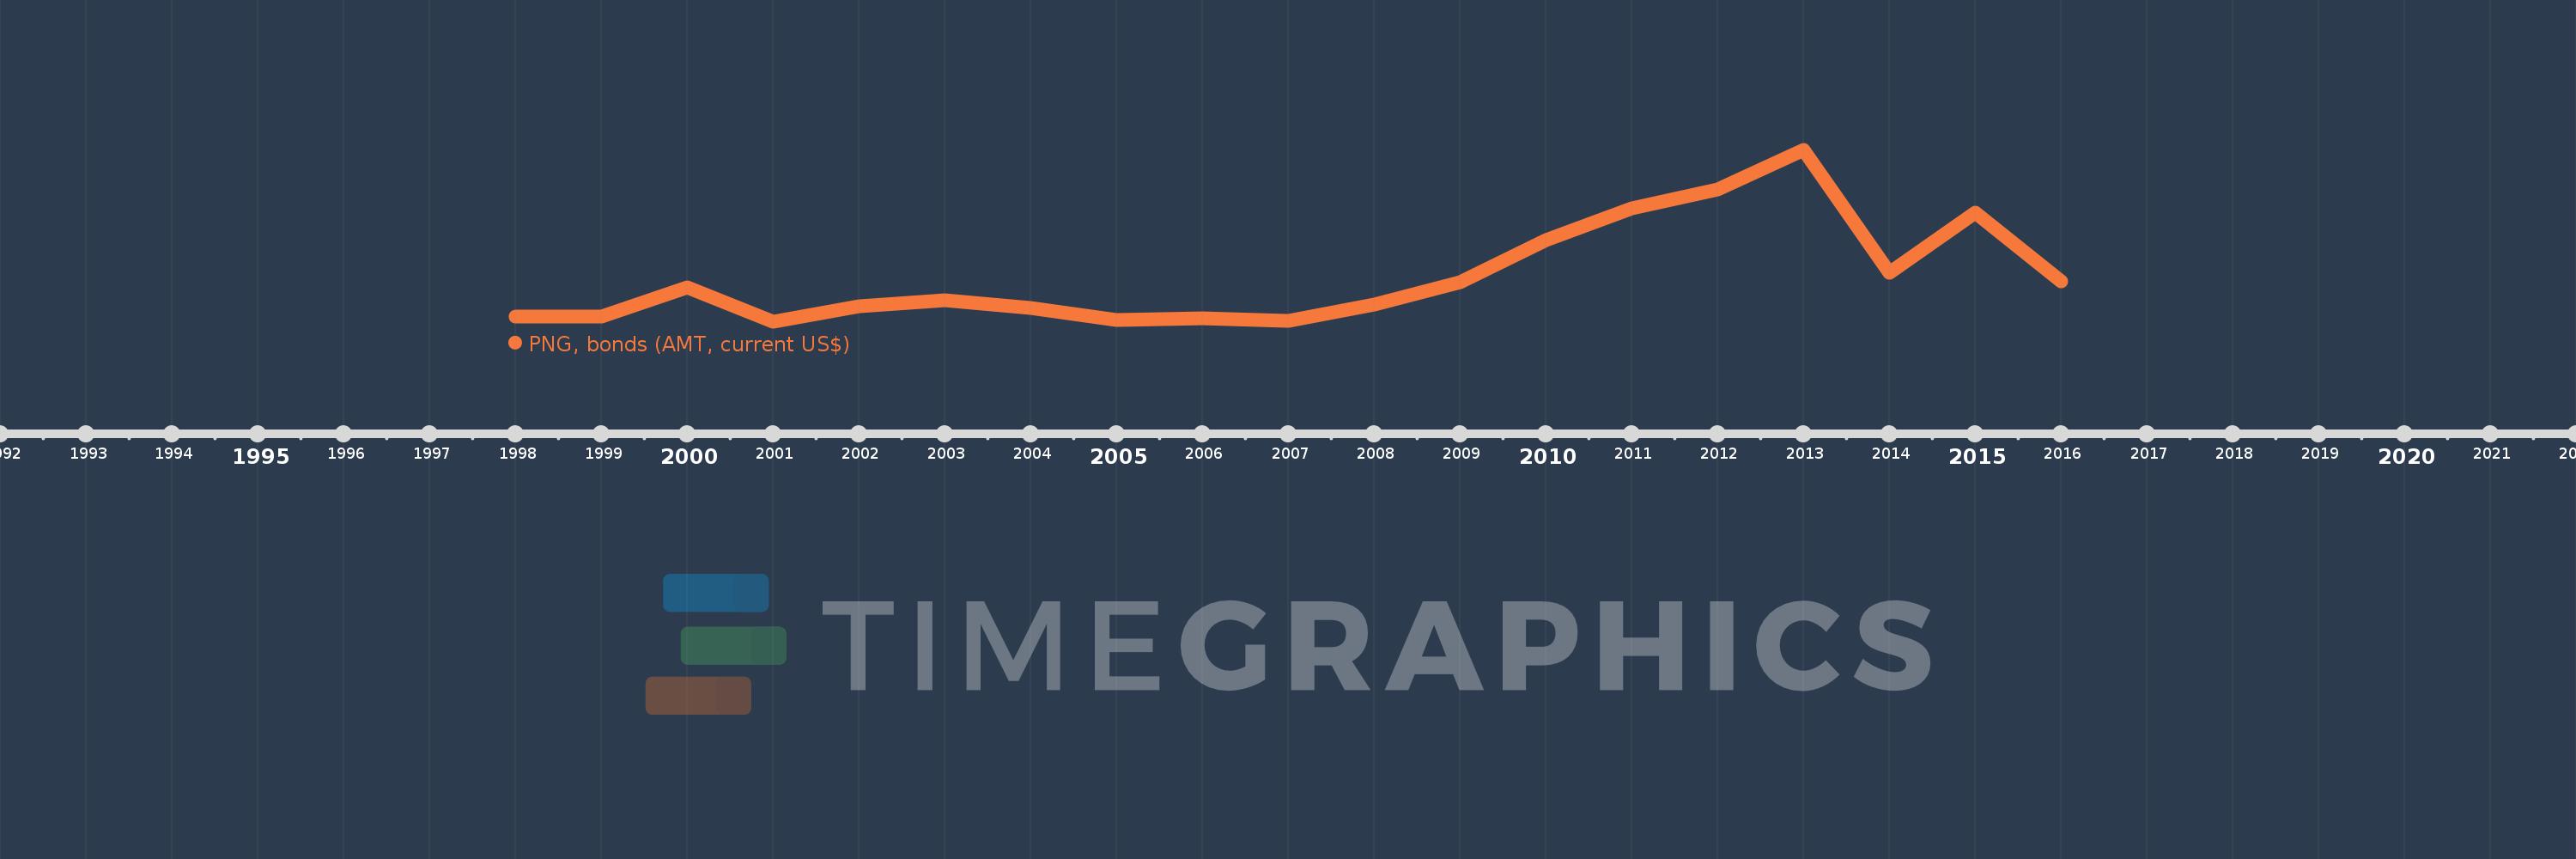
Timeline:
This timeline shows a graph from
1998
to
2016
of South Asia. No data until
1997
. Number of actual observations by date:
19
.
Source name:
World Development Indicators
Source organization:
World Bank, International Debt Statistics.
Categories, topics:
External Debt
Last updated:
apr 23, 2017
Indicators value changes by year
Meaning:
994.951 mln
Minimum:
35.0 mln
jan 1, 2001
Maximum:
3.678 bln
jan 1, 2013
At the date of observation
Value
Absolute change
Change from the previous value
jan 1, 1998
150.0 mln
+150.0 mln
0.0%
jan 1, 1999
149.21 mln
-790.0K
-0.53%
jan 1, 2000
764.994 mln
+615.784 mln
412.7%
jan 1, 2001
35.0 mln
-729.994 mln
-95.42%
jan 1, 2002
360.949 mln
+325.949 mln
931.28%
jan 1, 2003
490.295 mln
+129.346 mln
35.83%
jan 1, 2004
332.272 mln
-158.023 mln
-32.23%
jan 1, 2005
83.134 mln
-249.138 mln
-74.98%
jan 1, 2006
117.296 mln
+34.162 mln
41.09%
jan 1, 2007
56.978 mln
-60.318 mln
-51.42%
jan 1, 2008
409.196 mln
+352.218 mln
618.16%
jan 1, 2009
879.549 mln
+470.353 mln
114.95%
jan 1, 2010
1.779 bln
+899.479 mln
102.27%
jan 1, 2011
2.451 bln
+672.242 mln
37.79%
jan 1, 2012
2.847 bln
+395.517 mln
16.14%
jan 1, 2013
3.678 bln
+831.213 mln
29.2%
jan 1, 2014
1.083 bln
-2.595 bln
-70.56%
jan 1, 2015
2.347 bln
+1.265 bln
116.82%
jan 1, 2016
890.107 mln
-1.457 bln
-62.08%
Ranking of countries by current statistics by years
About & Feedback
Terms
Privacy
FAQ
Support 24/7
Cabinet
Get premium
Donate
The service accepts bank transfer (ACH, Wire) or cards (Visa, MasterCard, etc). Processed by Stripe.
Secured with SSL