33
/
AIzaSyB4mHJ5NPEv-XzF7P6NDYXjlkCWaeKw5bc
November 30, 2025
47523
Lower middle income
LMC
false
2
1
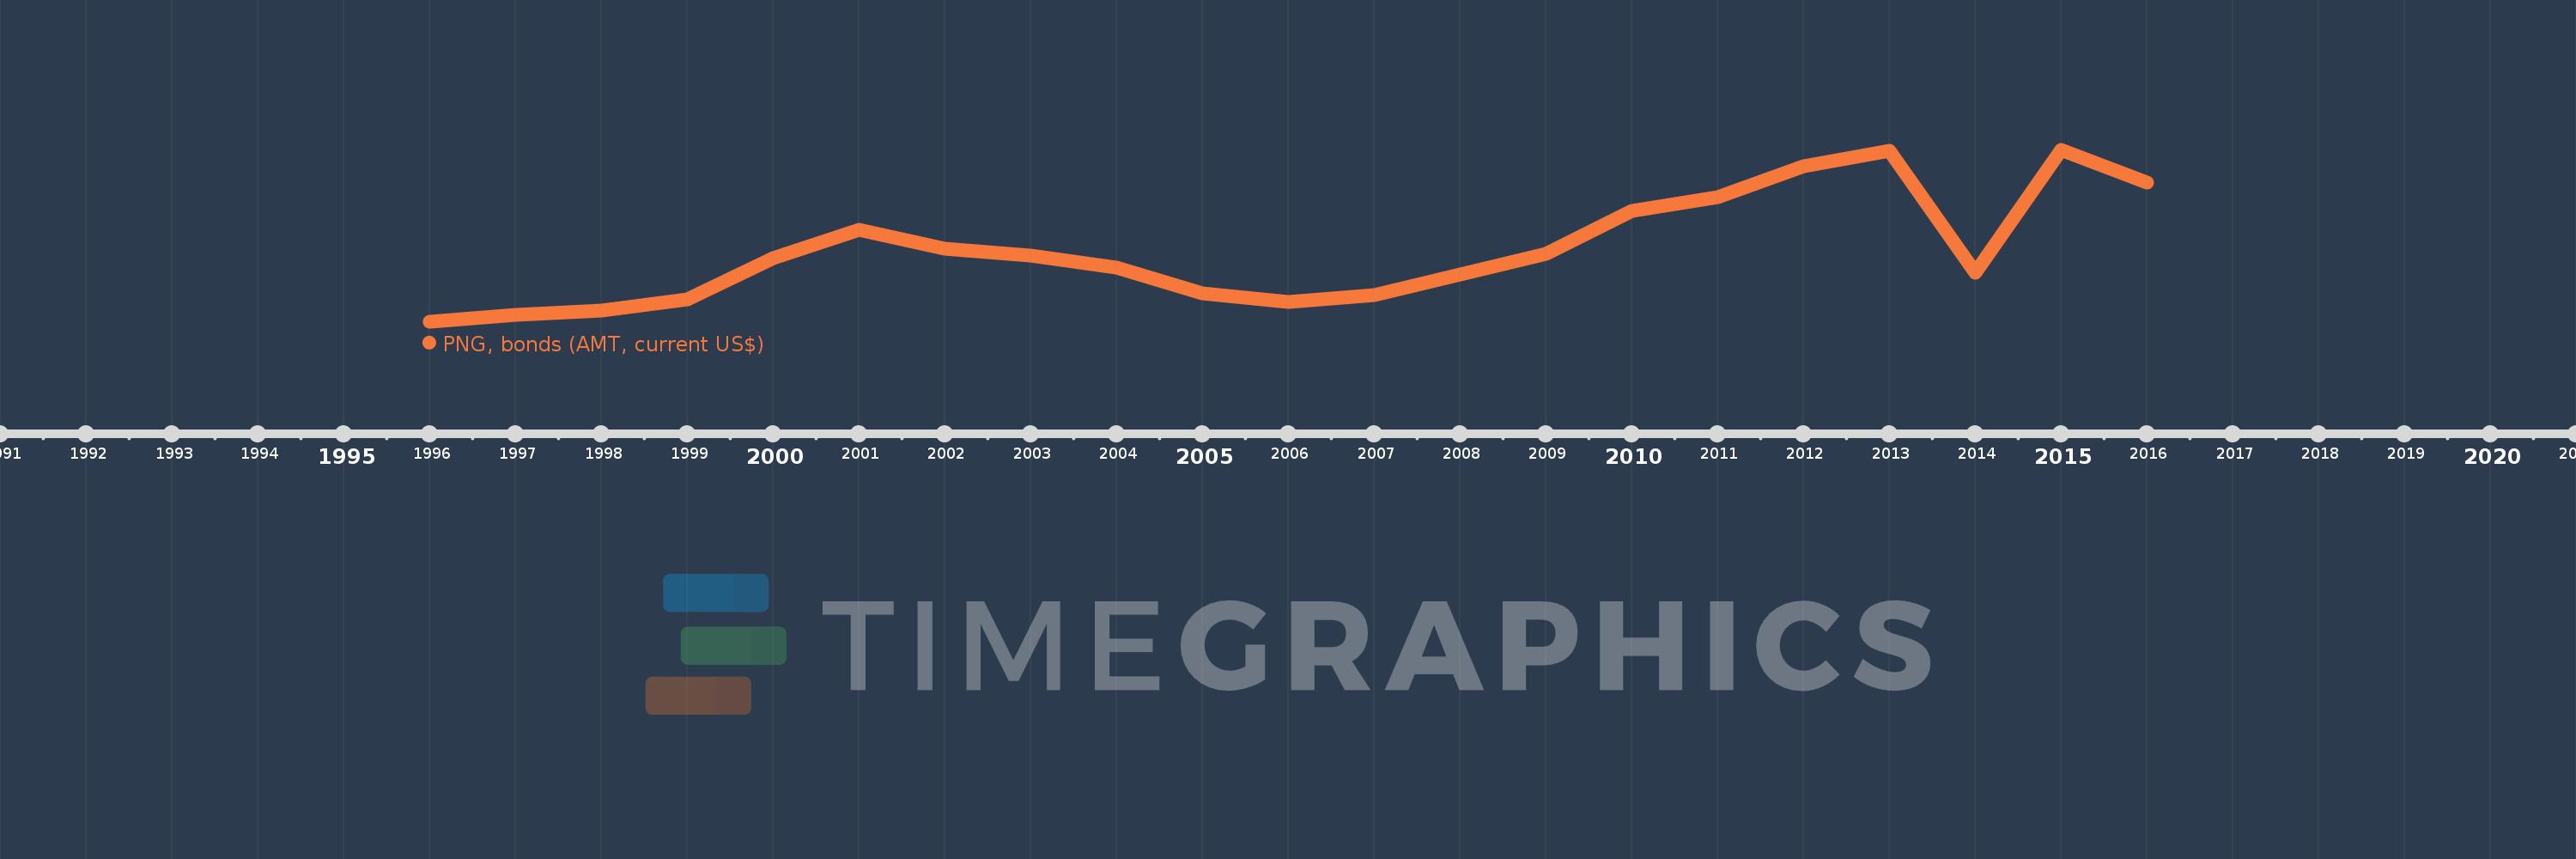
PNG, bonds (AMT, current US$)
2016,2015,2014,2013,2012,2011,2010,2009,2008,2007,2006,2005,2004,2003,2002,2001,2000,1999,1998,1997,1996
Create a timeline
Public Timelines
For education
For educational institutions
For teachers
For students
Cabinet
For educational institutions
For teachers
For students
Open cabinet
FAQ
Close
Create a timeline
Public timelines
FAQ
About & Feedback
Terms
Privacy
FAQ
Support 24/7
Cabinet
Get premium
Donate
Download
Global statistics library
→
Lower middle income
→
PNG, bonds (AMT, current US$)
This statistics in other country:
Argentina
Botswana
Brazil
Bulgaria
China
Colombia
Dominican Republic
East Asia & Pacific (excluding high income)
Ecuador
Egypt, Arab Rep.
Europe & Central Asia (excluding high income)
Ghana
Guatemala
IDA only
India
Indonesia
Jamaica
Kazakhstan
Latin America & Caribbean (excluding high income)
Lebanon
Low & middle income
Lower middle income
Malaysia
Mexico
Middle East & North Africa (excluding high income)
Middle income
Mongolia
Pakistan
Panama
Peru
Philippines
Romania
Russian Federation
Serbia
South Africa
South Asia
Sri Lanka
Sub-Saharan Africa (excluding high income)
Thailand
Turkey
Ukraine
Upper middle income
Venezuela, RB
Timeline:
This timeline shows a graph from
1996
to
2016
of Lower middle income. No data until
1995
. Number of actual observations by date:
21
.
Source name:
World Development Indicators
Source organization:
World Bank, International Debt Statistics.
Categories, topics:
External Debt
Last updated:
apr 23, 2017
Indicators value changes by year
Meaning:
2.262 bln
Minimum:
120.0 mln
jan 1, 1996
Maximum:
5.252 bln
jan 1, 2015
At the date of observation
Value
Absolute change
Change from the previous value
jan 1, 1996
120.0 mln
+120.0 mln
0.0%
jan 1, 1997
325.059 mln
+205.059 mln
170.88%
jan 1, 1998
458.639 mln
+133.58 mln
41.09%
jan 1, 1999
790.21 mln
+331.571 mln
72.29%
jan 1, 2000
2.023 bln
+1.233 bln
155.98%
jan 1, 2001
2.88 bln
+857.362 mln
42.39%
jan 1, 2002
2.316 bln
-564.016 mln
-19.58%
jan 1, 2003
2.11 bln
-206.392 mln
-8.91%
jan 1, 2004
1.753 bln
-356.937 mln
-16.92%
jan 1, 2005
961.829 mln
-790.942 mln
-45.13%
jan 1, 2006
717.719 mln
-244.11 mln
-25.38%
jan 1, 2007
917.396 mln
+199.677 mln
27.82%
jan 1, 2008
1.528 bln
+610.671 mln
66.57%
jan 1, 2009
2.162 bln
+634.077 mln
41.5%
jan 1, 2010
3.45 bln
+1.288 bln
59.59%
jan 1, 2011
3.837 bln
+386.998 mln
11.22%
jan 1, 2012
4.776 bln
+938.056 mln
24.44%
jan 1, 2013
5.238 bln
+462.639 mln
9.69%
jan 1, 2014
1.593 bln
-3.646 bln
-69.6%
jan 1, 2015
5.252 bln
+3.659 bln
229.76%
jan 1, 2016
4.285 bln
-966.661 mln
-18.41%
Ranking of countries by current statistics by years
About & Feedback
Terms
Privacy
FAQ
Support 24/7
Cabinet
Get premium
Donate
The service accepts bank transfer (ACH, Wire) or cards (Visa, MasterCard, etc). Processed by Stripe.
Secured with SSL