Download This statistics in other country:
Timeline:
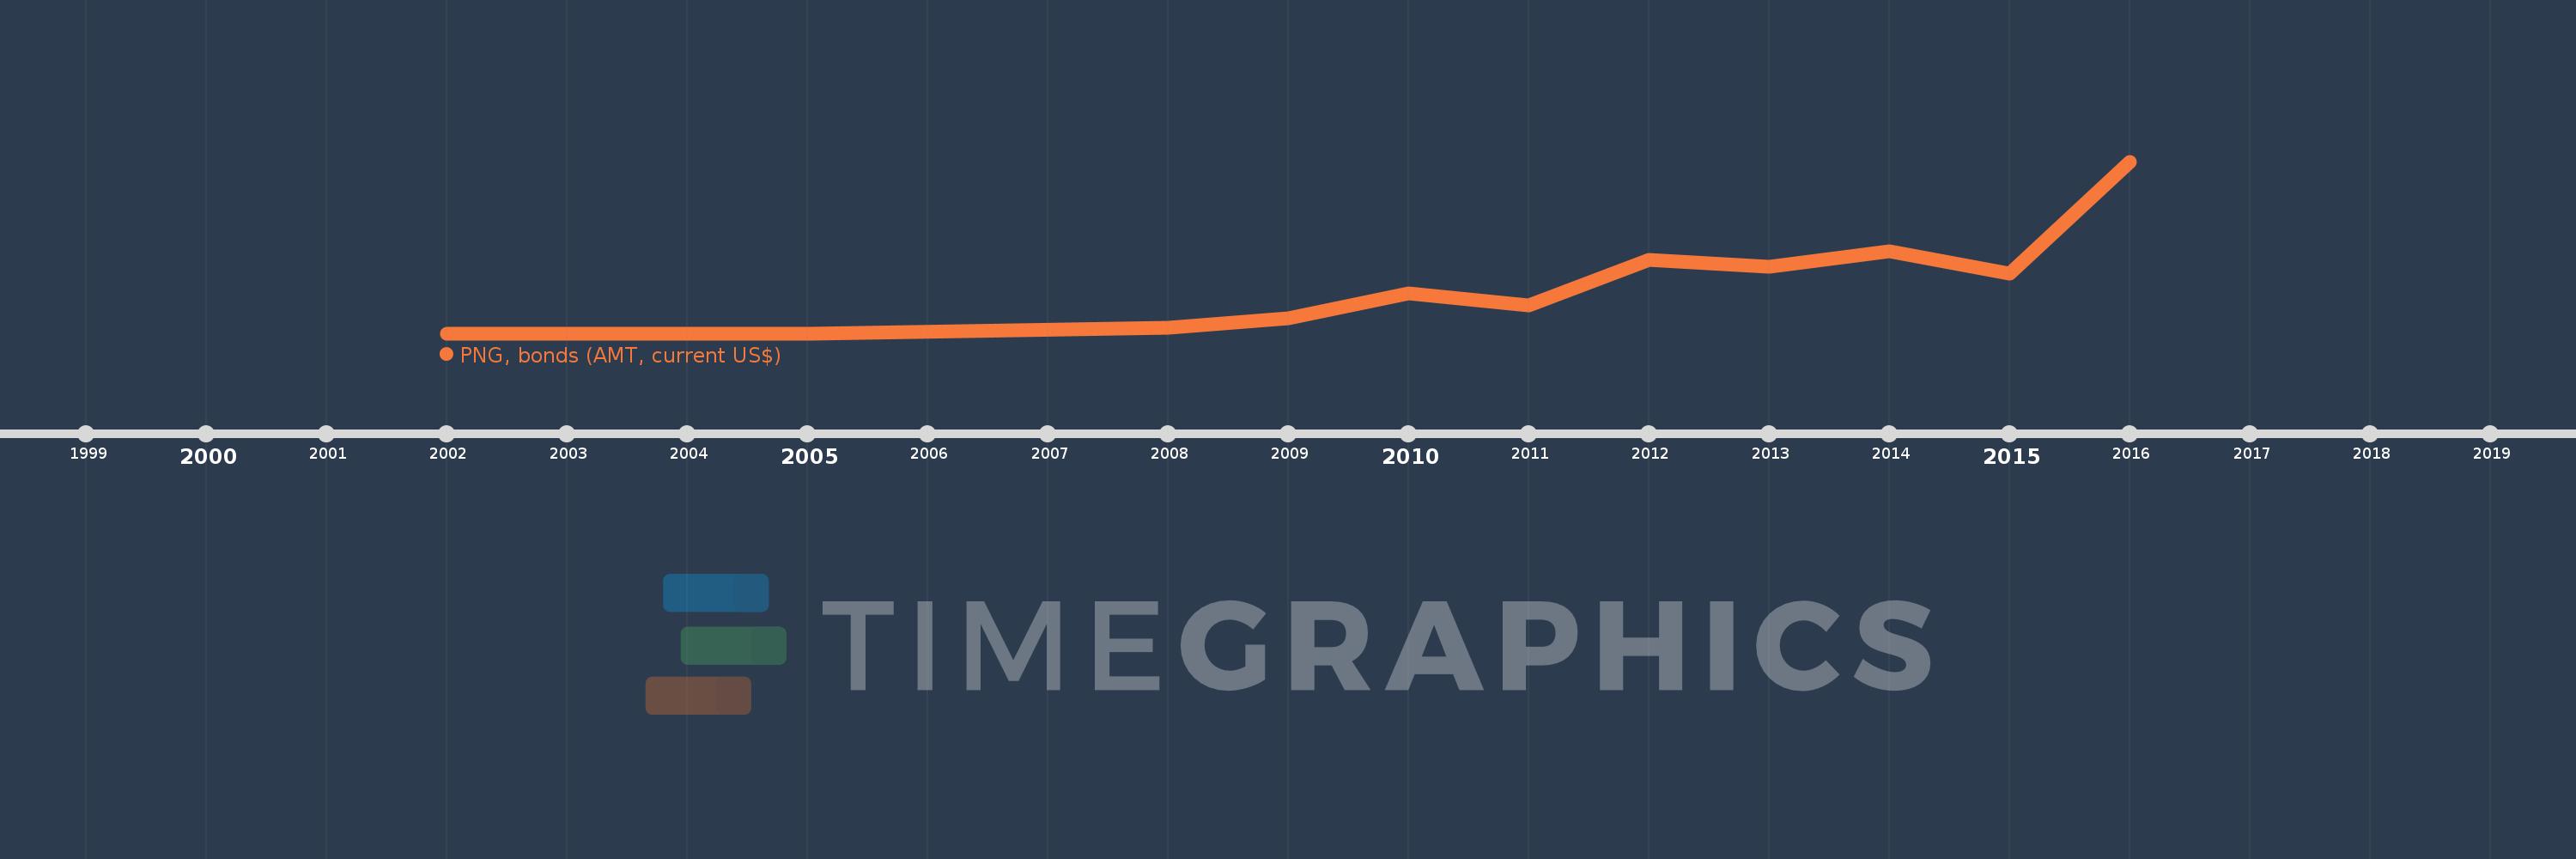
This timeline shows a graph from 2002 to 2016 of Kazakhstan. No data until 2001. Number of actual observations by date: 11.
Source name:
World Development Indicators
Source organization:
World Bank, International Debt Statistics.
Categories, topics:
External Debt
Last updated:
apr 23, 2017
Indicators value changes by year
Minimum:
100.0 mln
jan 1, 2002
Maximum:
8.709 bln
jan 1, 2016
At the date of observation
Value
Absolute change
Change from the previous value
jan 1, 2002
100.0 mln
+100.0 mln
0.0%
jan 1, 2005
100.0 mln
0.0
0.0%
jan 1, 2008
400.0 mln
+300.0 mln
300.0%
jan 1, 2009
850.0 mln
+450.0 mln
112.5%
jan 1, 2010
2.108 bln
+1.258 bln
147.97%
jan 1, 2011
1.503 bln
-604.413 mln
-28.68%
jan 1, 2012
3.789 bln
+2.285 bln
152.01%
jan 1, 2013
3.457 bln
-331.579 mln
-8.75%
jan 1, 2014
4.21 bln
+752.602 mln
21.77%
jan 1, 2015
3.092 bln
-1.118 bln
-26.55%
jan 1, 2016
8.709 bln
+5.618 bln
181.69%
Ranking of countries by current statistics by years